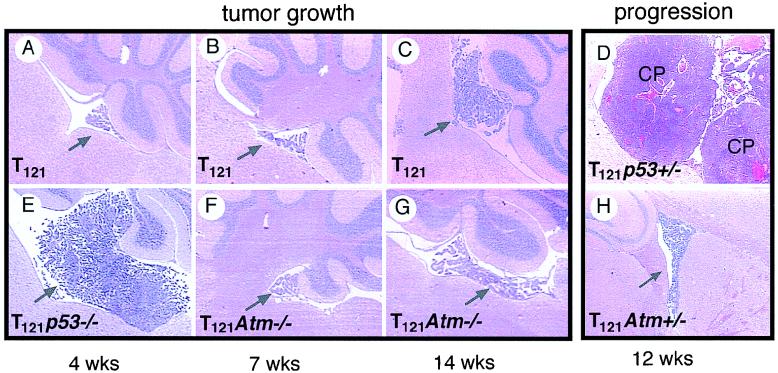
FIG. 5.
Effects of Atm deficiency on CP tumor growth and progression. Sizes of the CP masses (arrows) are shown. TgT121 mice at 7 weeks (B) and 14 weeks (C) are compared to TgT121 Atm−/− littermates (F and G, respectively). Note that p53 deficiency greatly accelerated tumor growth as indicated by the mass size at 4 weeks (E versus A). CP tumor progression to aggressive angiogenic states was observed in TgT121 p53+/− mice (D) but not in TgT121 Atm+/− mice (H). These views represent the largest mass present among step sections sampled from the full brain to ensure a fair comparison of tumor sizes.

