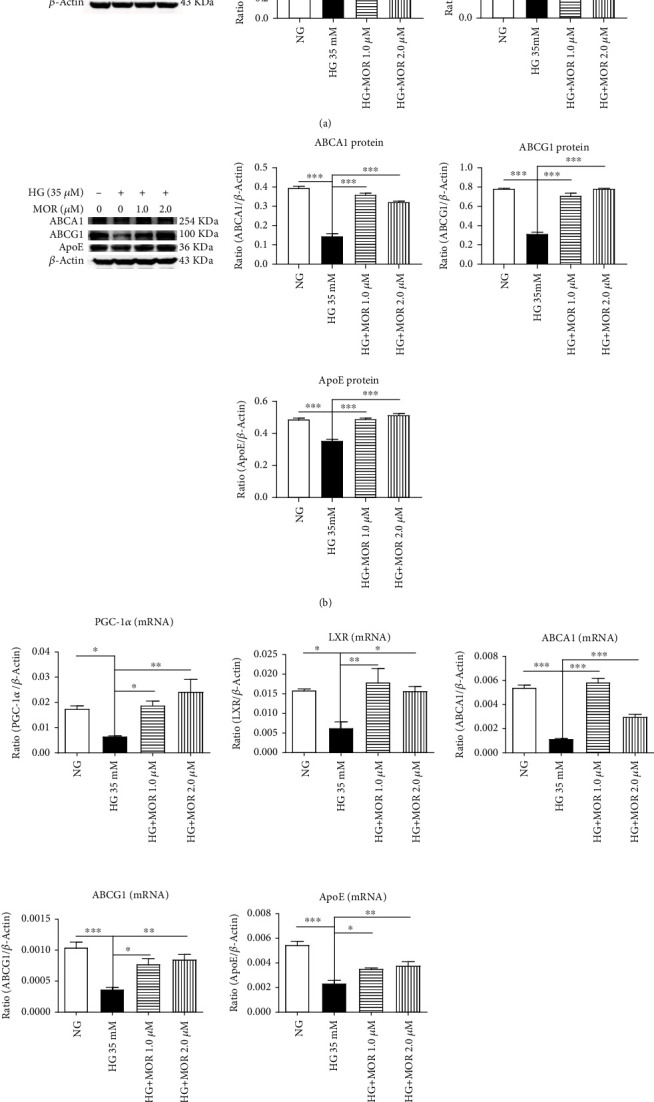
Figure 6.

After treatment with MOR, expressions of PGC-1α, LXR, ABCA1, ABCG1, and ApoE were upregulated in mRTECs stimulated by HG. (a) Western blot analysis of PGC-1α and LXR expressions in mRTECs cultured for 24 hours. (b) Western blot analysis of ABCA1, ABCG1, and ApoE expressions in mRTECs cultured for 36 hours. (c) Real-time PCR analysis of PGC-1α and LXR expressions in mRTECs cultured for 24 hours. Real-time PCR analysis of ABCA1, ABCG1, and ApoE expressions in mRTECs cultured for 36 hours. Data represent the mean ± SEM (n = 3). ∗P < 0.05, ∗∗P < 0.01, and ∗∗∗P < 0.001 compared with the HG group.
