Figure 3.

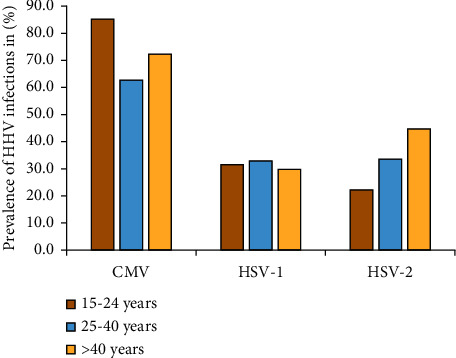
Distribution of HHV coinfections among different age groups in key population groups. The figure depicts the distribution (frequency) of HHVs (CMV, HSV-1, and HSV-2) coinfections among the key populations with reference to age categories.

Distribution of HHV coinfections among different age groups in key population groups. The figure depicts the distribution (frequency) of HHVs (CMV, HSV-1, and HSV-2) coinfections among the key populations with reference to age categories.