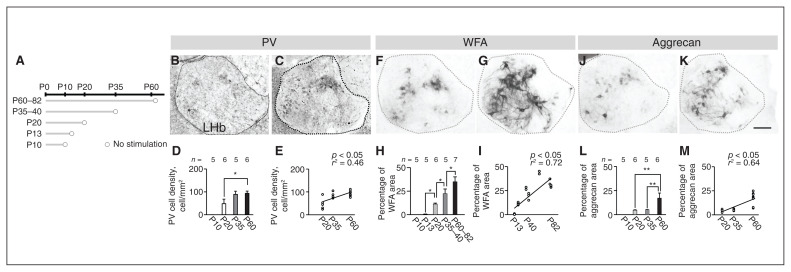
Figure 1.
Maturation of PV neurons and PNNs in the LHb. (A) Schematic diagram of experiments. (B and C) PV neurons at P20 and P60. (D) Cell densities at each postnatal day. (E) Correlation between postnatal day and cell density is shown using a simple regression test. (F and G) WFA lectin staining at P20 and P60. (H) Percentage of WFA area at each postnatal day. (I) Correlation between postnatal day and percentage of WFA lectin staining area is shown using a simple regression test. (J and K) Anti-aggrecan immunoreactivities at P20 and P60. (L) Percentage of aggrecan area at each postnatal day. (M) Correlation between postnatal day and percentage of anti-aggrecan immunoreactivity area using a simple regression test. Scale bar = 100 μm. Error bars represent standard error of the mean. The square correlation coefficient (r) and p values of the slope are shown. *p < 0.05, **p < 0.01, Steel–Dwass multiple comparison test. LHb = lateral habenula; P = postnatal day; PNN = perineuronal nets; PV = parvalbumin; WFA = wisteria floribunda agglutinin.

