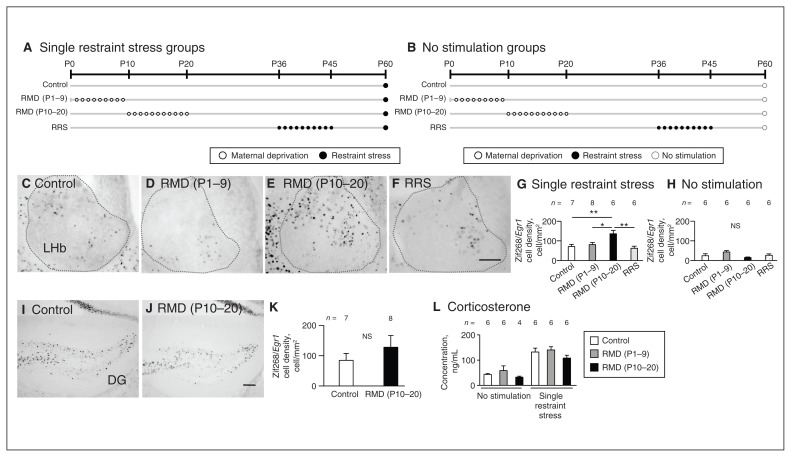
Figure 3.
Neuronal hyperreactivity to single restraint stress in the adult LHb under the influence of early-life stress at P10–20. (A and B) Schematic diagram of experiments with single restraint stress and no stimulation. In the LHb, Zif268/Egr1 immunopositive cells in response to single restraint stress are shown in the (C) control, (D) RMD (P1–9), (E) RMD (P10–20) and (F) RRS groups. (G and H) Zif268/Egr1 immunopositive cell densities are compared between the groups after single restraint stress and no stimulation. (I and J) In the dentate gyrus, Zif268/Egr1 immunopositive cells after single restraint stress in the control and RMD (P10–20) groups. (K) Comparison of Zif268/Egr1 immunopositive cell densities. (L) After single restraint stress or no stimulation, comparison of plasma corticosterone concentrations for the control, RMD (P1–9) and RMD (P10–20) groups at P60–67. Scale bar = 100 μm. Error bars represent standard error of the mean. *p < 0.05, **p < 0.01, Tukey honestly significant difference test. DG = dentate gyrus; LHb = lateral habenula; NS = not significant; P = postnatal day; RMD = repeated maternal deprivation; RRS = repeated restraint stress.

