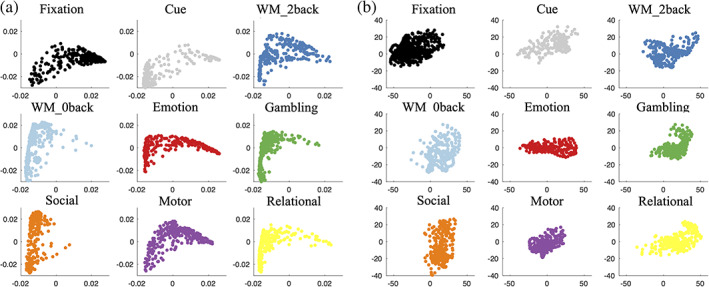
FIGURE 3.

Each task independently visualized in the embedding. (a) 2‐step Diffusion Maps embedding. (b) 2‐step PCA embedding. The x, y axis limits are kept the same within (a) and (b) for better cross‐task comparison. The same task block colormap is the same used in Figure 2a. PCA, principal component analysis
