
FIGURE 4.
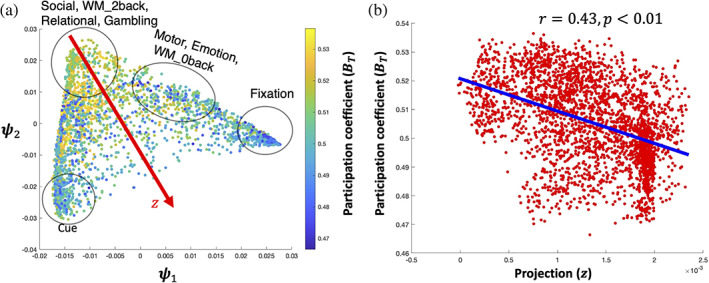
2sDM embedding is related with participation coefficient. (a) 2sDM embedding in HCP dataset colored by the time‐resolved . (b) Scatter plot of the with the projection onto the diagonal of the embedding structure (). Correlation of with is shown with a line of best fit. Projection direction was determined manually as the approximate diagonal direction of the embedding. HCP, Human Connectome Project; 2sDM, 2‐step Diffusion Maps