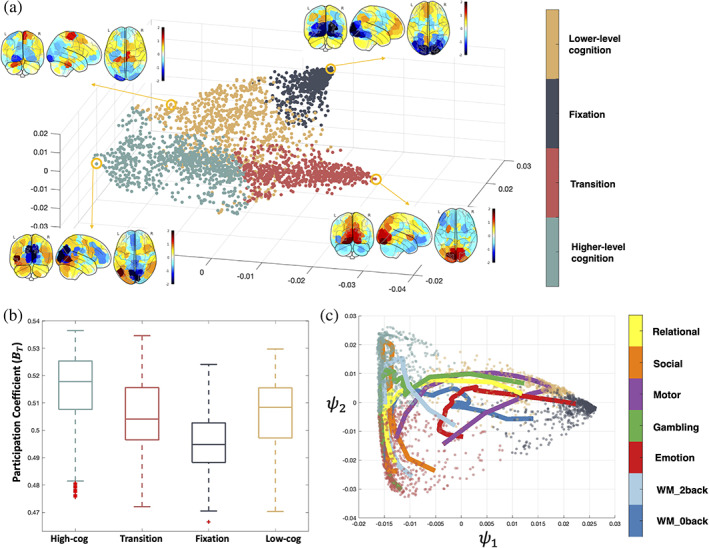
FIGURE 5.

Brain states during tasks. (a) Results of k‐means clustering of the task manifold. Averaged brain activation patterns across subjects in the circled representative time points are shown for each brain state. (b) averaged over all the time points in each brain state. (c) Two‐dimensional view of task trajectories with the embedding points. Trajectories are colored by each task and data points are colored by the brain states as in (a)
