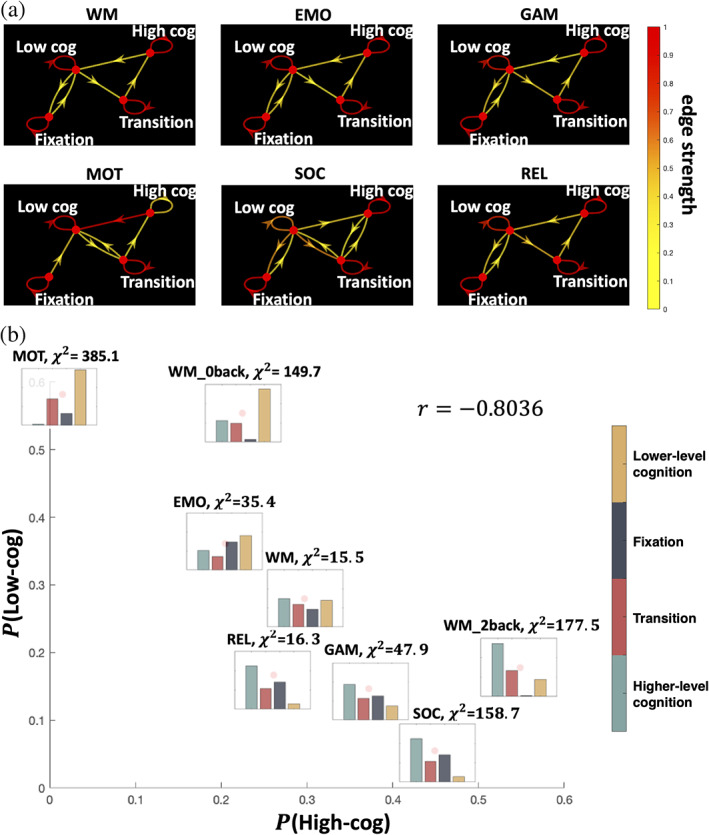
FIGURE 6.

Brain state dynamics differ between tasks. (a) Brain state dynamics visualized as the Markov chain. Transition probability is visualized by the color of the directed edges. Edges with transition probability less than 0.03 are omitted for clarity. (b) Stationary distribution probability visualized for each task and positioned by the proportion of higher‐level cognition and lower‐level cognition brain states. Chi‐square test result against the uniform distribution is also shown
