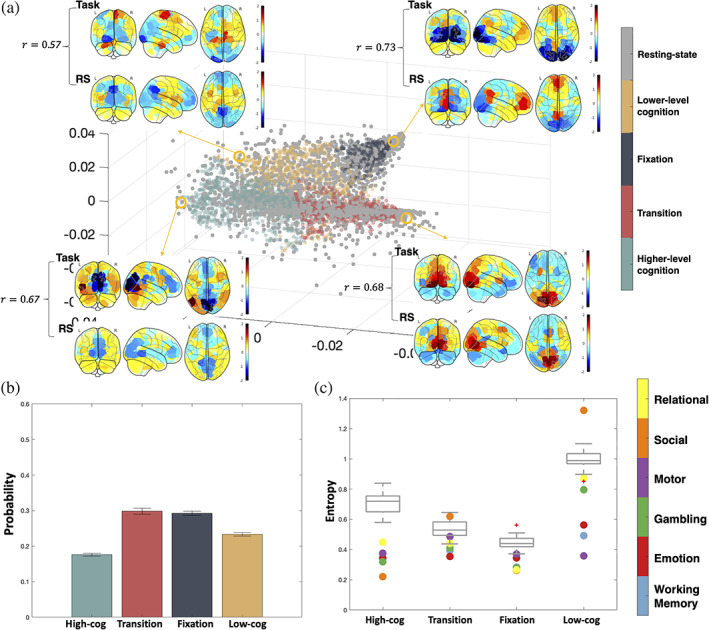
FIGURE 7.

Resting‐state extended onto the task manifold. (a) Representative task activation patterns of each state and the neighboring resting‐state activation pattern are visualized. Correlation of the activation between task and rest is calculated with higher correlation representing more accurate out‐of‐sample extension. (b) Stationary probability distribution of the four brain states during resting state. (c) Entropy of each brain state's transition probability in different tasks. Dots are colored by tasks they represent, and the gray box plot shows the entropy values of resting state with BrainSync (see Section 2) referenced to different individuals
