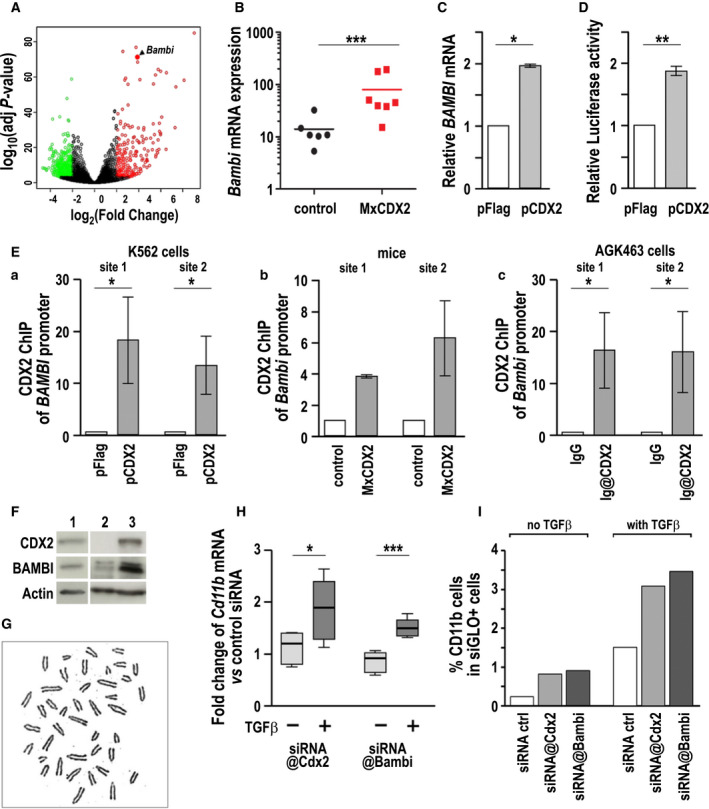
Fig. 5.

Involvement of BAMBI in the oncogenic effect of CDX2. (A) Volcano plot of the differentially expressed genes in the bone marrow of MxCDX2 compared with control littermates. Red: upregulated genes; green downregulated genes. The position of Bambi is indicated. (B) Comparative expression of the Bambi gene by RT‐qPCR in MxCDX2 (n = 7) and control mice (n = 6). Bars represent means, ***P < 0.001. (C) Expression of the BAMBI gene in human K562 cells transfected with the pFlag‐CDX2 plasmid compared to cells transfected with the control pFlag vector. n = 3; data are given means with SEM. *P < 0.02. (D) Luciferase activity produced by pBAMBI‐Luc in human K562 cells transfected with pFlag‐CDX2 or with pFlag. n = 9; data are given means with SEM. **P < 0.01. (E) CDX2 chromatin immunoprecipitation of BAMBI promoter fragments overlapping the CDX‐type DNA‐binding sites 1 and 2 (a) in human K562 cells transfected with pFlag‐CDX2 vs pFlag (n = 5), (b) in bone marrow cells of MxCDX2 vs control mice (n = 2), and (c) in mouse AGK463 nuclear extracts immunoprecipitated with anti‐CDX2 antibodies or with control IgG (n = 5). Data are given means with SEM. *P < 0.05. (F) Expression of the CDX2 and BAMBI proteins by western blot in AGK463 cells (lane 1) in comparison with the bone marrow of control and MxCDX2 mice (respectively, lanes 2 and 3). (G) Karyotype analysis revealing supernumerary chromosomes (n = 41) in the AGK463 cell line. (H) Relative Cd11b mRNA expression in AGK463 cells transfected with siRNA@CDX2 or siRNA@Bambi compared with control siRNA, in the absence or presence of TGF‐β (n = 9). Boxes extend from 25th to 75th percentile, and whiskers represent mean to max. *P < 0.05; ***P < 0.001. (I) Proportion of CD11b+ cells among siGLO+ AGK463 cells transfected with siGLO and the indicated siRNA, and treated or not with TGF‐β.
