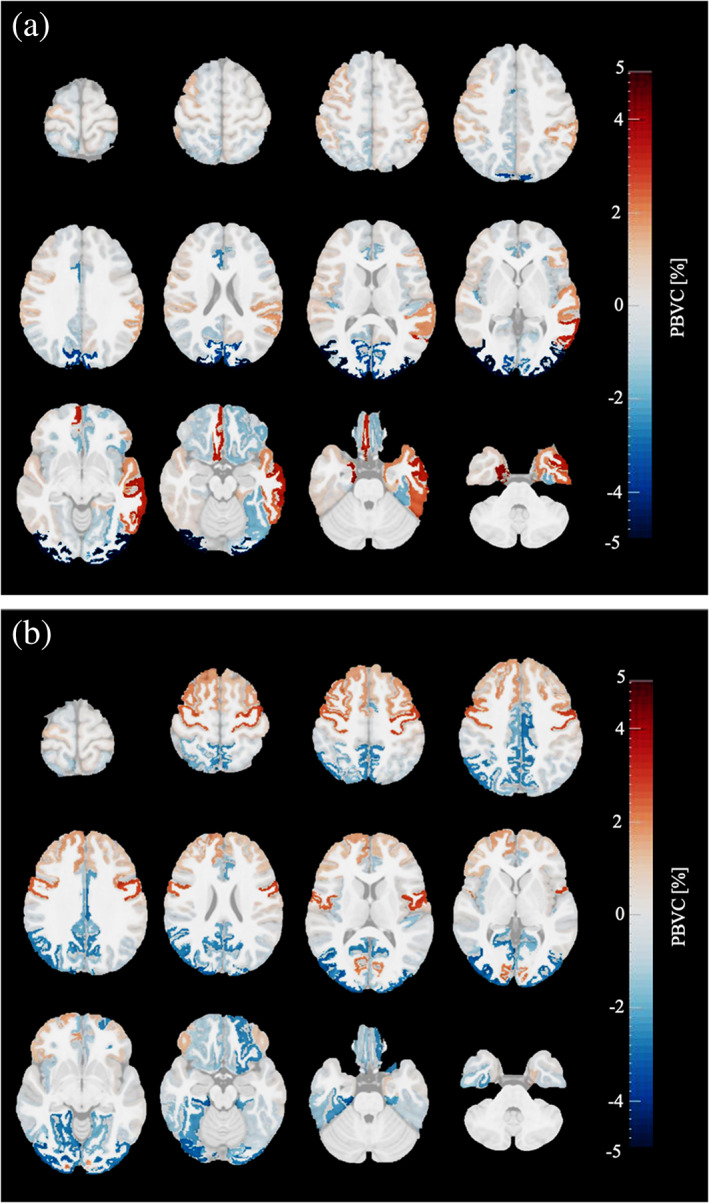
FIGURE 4.

Mean percentage brain volume changes (PBVC+scaling) per cortical gray matter regions of children with typical reading skills occurring during a) early reading stage (n = 23) and (b) advanced reading stage (n = 20) of primary school. Red colored regions depict a volume increase and blue colored regions a volume decrease. The brighter the color, the larger the volume change; the more transparent, the lower the evidence for volume change. Images are shown in radiological convention: the left hemisphere is displayed on the right side of the image
