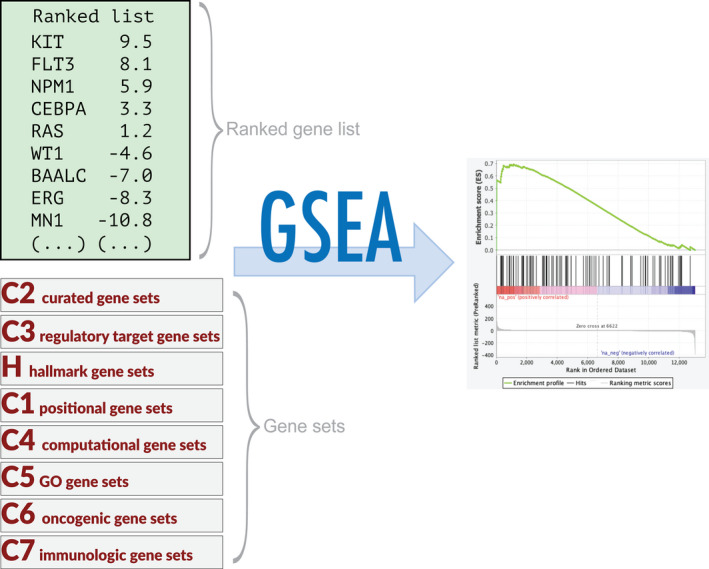
Fig. 2.

Exemplar for pathway analysis workflow. After differential expression analysis the list of differentially expressed genes can be used for GSEA as a preranked gene list (other input options are also available). Depending on your research interests, one or more gene sets can be selected and GSEA will calculate a score reflecting whether each gene set is overrepresented at the extremities of the ranked gene list. The graph shows the enrichment profile, and the enrichment score (ES) is the point furthest from zero. ES values, normalised ES, false discovery rate and other information are contained in the results report.
