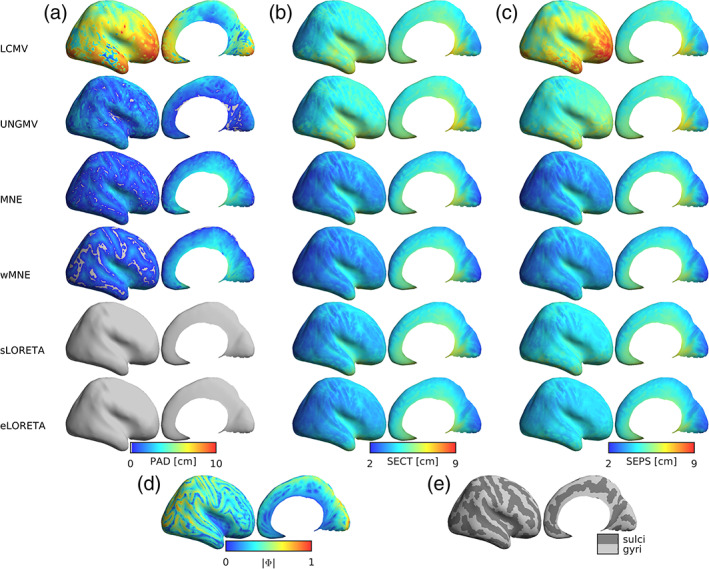
FIGURE 4.

Spatial distributions of resolution metrics. (a–c) Lateral and medial views (left and right columns) of PAD, SECT, and SEPS (respectively) for each dipole in each algorithm. (d) The norm of the leadfield for each dipole. (e) Anatomical maps of gyri and sulci, derived in Freesurfer. For all figures, distributions are shown on a smoothed cortical surface for visualization purposes, and are shown for the same representative participant
