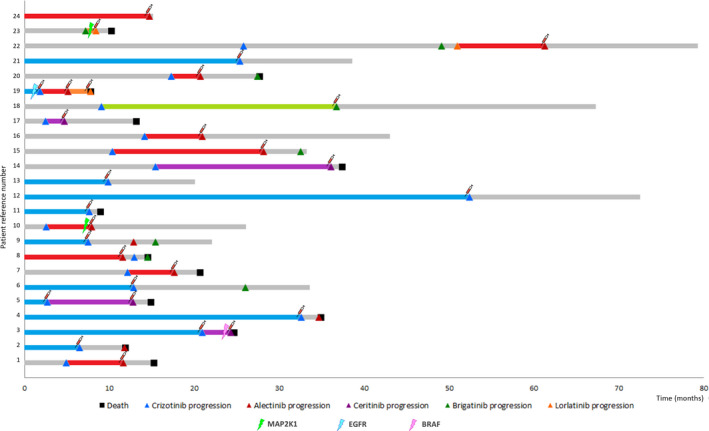
Fig. 1.

Swimmer chart showing the individual treatment responses of the study cohort. Blue, red, purple, green, and orange bars correspond to response duration of patients who were treated with crizotinib, alectinib, ceritinib, brigatinib, and lorlatinib, respectively, and from whom a blood sample was taken at the time of disease progression (syringe icon). Gray bars denote treatments responses to therapy for which samples at disease progression could not be analyzed (out of study). Tumor progression is denoted by triangle, and patient's death is denoted by a squared. Mutations in BRAF, EGFR, and MAP2K1 are indicated by a lightning.
