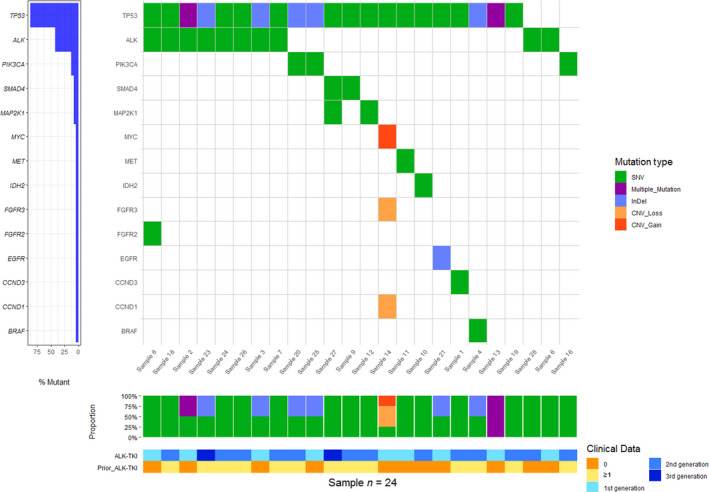
Fig. 2.

Co‐mutation plot according to ctDNA profiling by NGS. Each column represents data from a single patient. Each row represent data from a specific gene. Indels are represented in blue whereas missense mutations are represented in green. CNVs are colored in orange. Heat map at the bottom illustrates type of treatment received.
