
FIGURE 2.
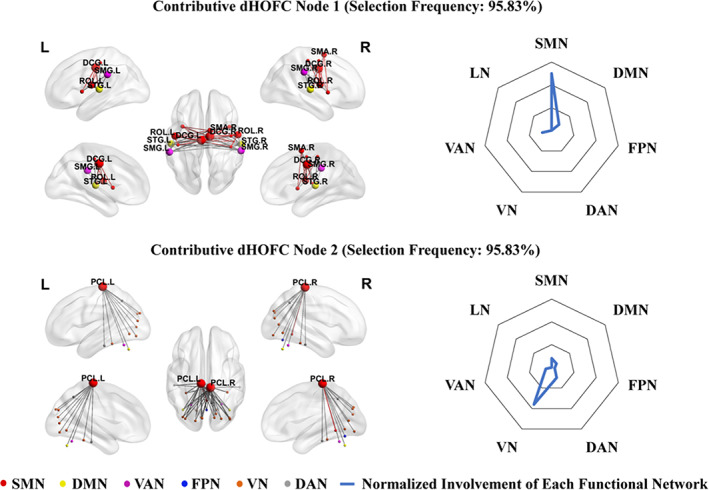
The left panel shows the top two discriminative dynamics‐based high‐order functional connectivity (dHOFC) nodes selected from classification between type 2 diabetes mellitus with cognitive impairment (T2DM‐CI) and healthy controls (HC) according to the selection frequency (95.83%). The colored nodes represent brain regions in different large‐scale brain networks derived from Yeo et al. (2011) and Buckner et al. (2011). The node size reflects the number of involved highly co‐varied dFC links with other regions. The color of the links represents intra‐network connections (in respective network's color) or inter‐network connections (gray). The right panel shows the radar maps of the relative involvement of each dHOFC node with respect to seven large‐scale functional networks