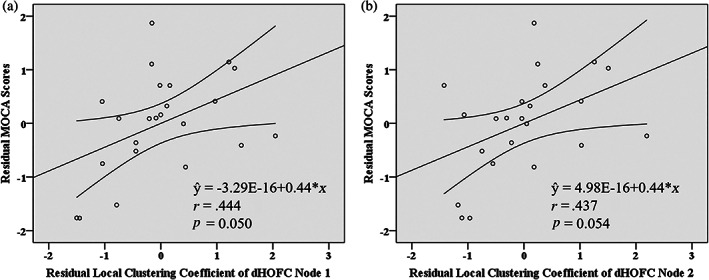
FIGURE 3.

Scatter plots of the dynamics‐based high‐order functional connectivity (dHOFC) features [(a) and (b) represent the local clustering coefficients of the dHOFC node 1 and node 2, respectively, shown in Figure 2] against Montreal Cognitive Assessment (MoCA) scores in the group of type 2 diabetes mellitus with cognitive impairment (T2DM‐CI). Both values were corrected by removing the effect of age, gender, and education level. The straight lines denoted fitted lines, and the curves on both sides were the 95% confidence interval. The P and r values were derived from partial correlation analysis
