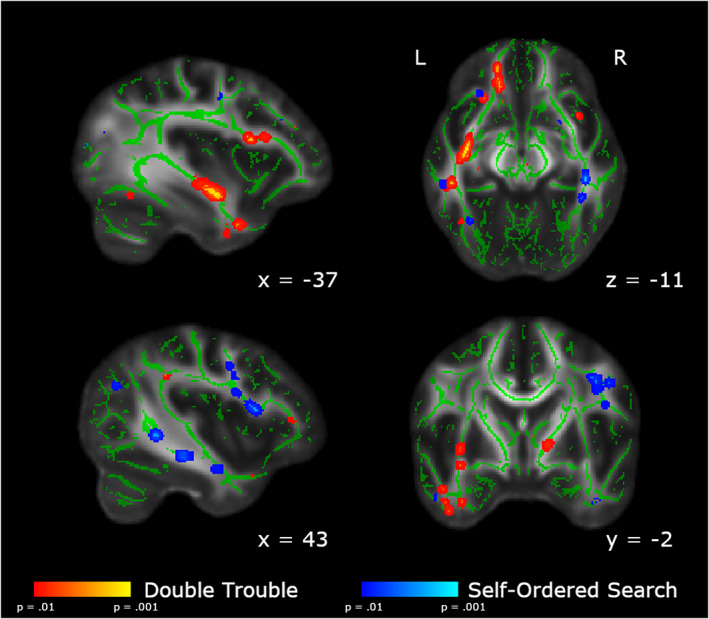
FIGURE 6.

Areas showing group differences in the change in FA from Baseline to Scan 2. In red, we show the areas in which the changes from Baseline to Scan 2 are significantly larger in the Double Trouble training group than in the Self‐Ordered Search training group. In blue, we show the areas in which the changes from Baseline to Scan 2 are significantly larger in the Self‐Ordered Search training group than in the Double Trouble training group. Clusters have been thickened for visualization using tbss_fill, and results are overlaid on the FMRIB58_FA template and the mean skeletonized FA data of the current sample
