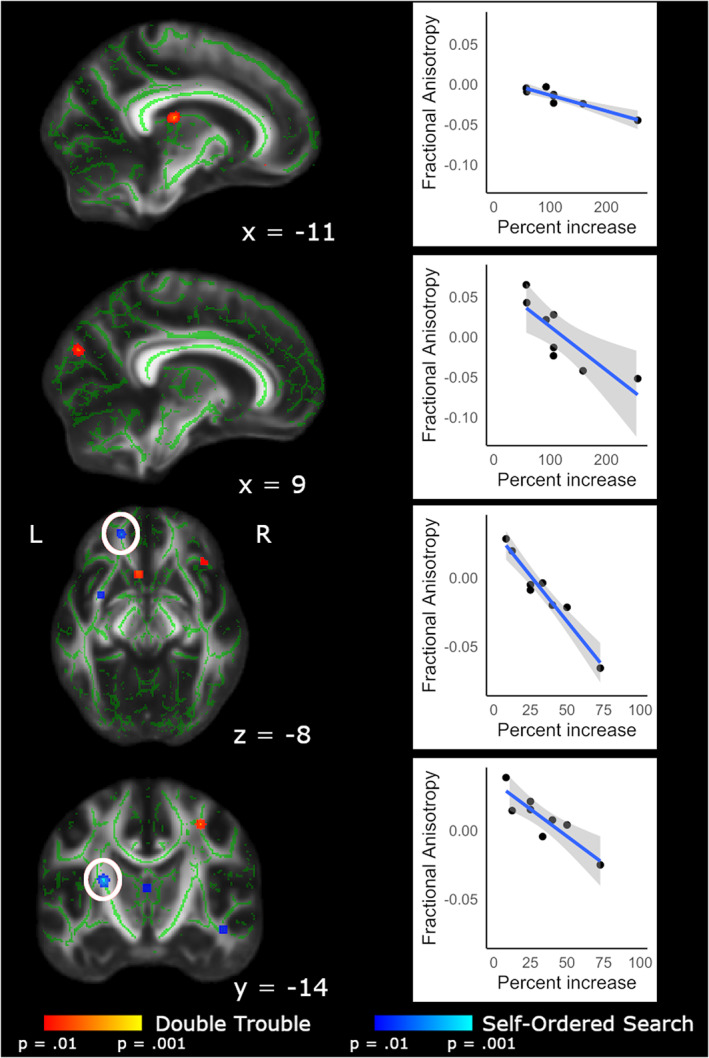
FIGURE 8.

FA values from Scan 5–Baseline difference maps, correlated with Scan 5–Baseline difference scores. Within the brain maps, red depicts areas in which Double Trouble scores correlated with FA changes within that training group; blue depicts areas in which the Self‐Ordered Search scores correlated with FA changes within that training group. Scatterplots show the relationship between difference score on the task and change in FA from Baseline to Scan 5. Clusters have been thickened for visualization using tbss_fill, and results are overlaid on the FMRIB58_FA template and the mean skeletonized FA data of the current sample. White circles indicate the region of interest displayed in the corresponding scatterplot
