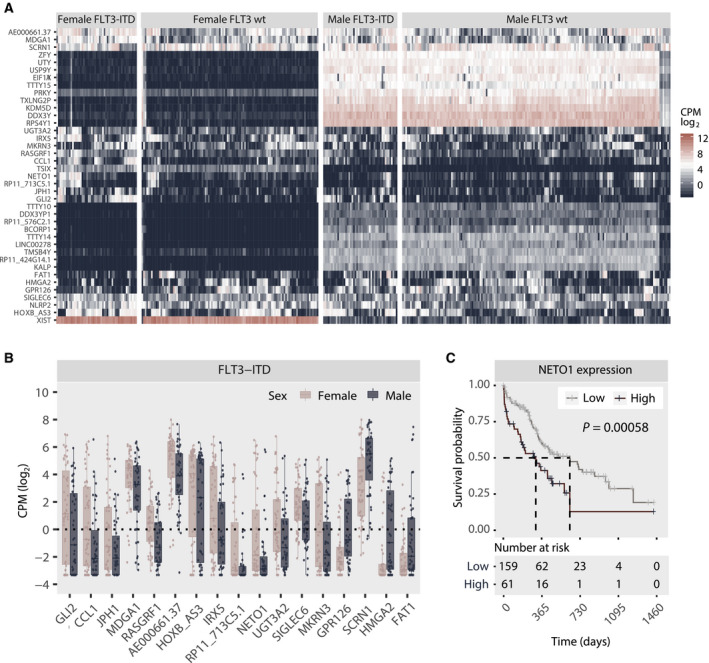
Fig. 2.

(A) Heatmap depicting unsupervised clustering of CPM‐log2 values of all transcripts differentially expressed between female and male FLT3‐ITD‐positive individuals. Clustering was done by columns and rows and then manually faceted by FLT3‐ITD status and sex. (B) Pairwise comparison of the 17 transcripts identified as differentially expressed between female and male FLT3‐ITD‐positive samples based on the results of the DGE analysis, excluding samples also significantly different in the FLT3‐wt subgroup. Only statistically significant results are shown. Statistical significance was evaluated using the Wilcoxon rank sum test/Mann–Whitney test. Each dot represents an individual specimen, and the box plot graphically presents the median and the spread. The lower and upper hinges correspond the 25th and 75th percentiles, respectively, and the upper and lower whisker extends to the largest and smaller values (no further than 1.5 times the total interquartile range from the hinges). Only FLT3‐positive samples are presented. The same comparison for FLT3‐ITD‐negative samples is available in Fig. S9. (C) Kaplan–Meier curve comparing the outcome of patients characterized by high (n = 61) and low (n = 159) mRNA expression (log2 CPM) of NETO1. Statistical significance is evaluated using the log‐rank test. P = 0.00058.
