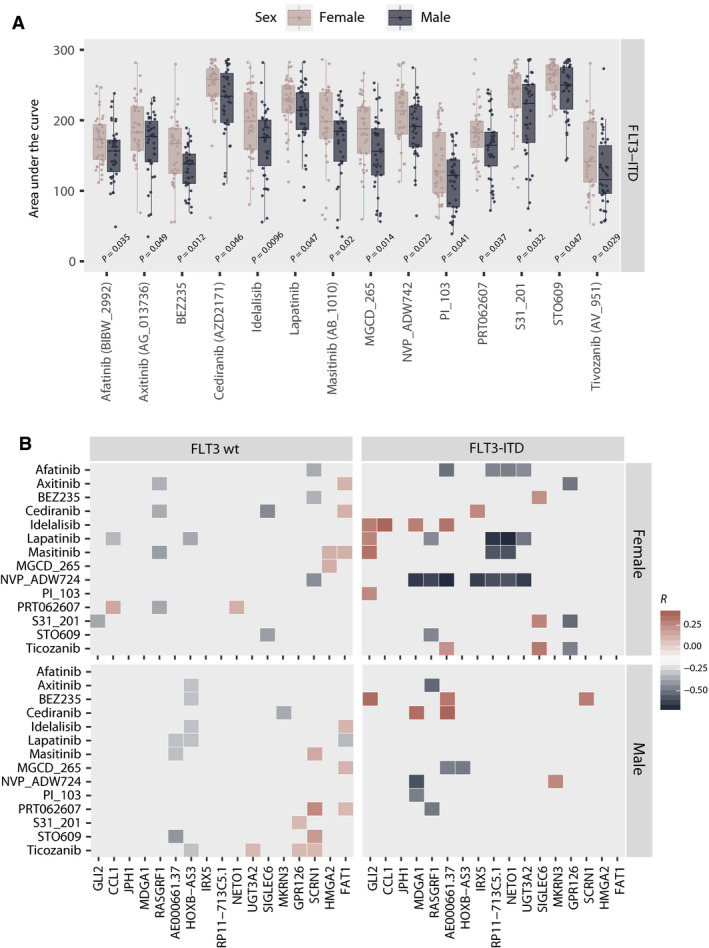
Fig. 3.

(A) Comparison of AUC between FLT3‐ITD‐mutated female and male specimens for the 14 compounds identified to demonstrate significant sex‐related divergence. The same comparison for FLT3‐ITD‐negative samples is available in Fig. S13. Statistical significance (P < 0.05) was evaluated using the Wilcoxon rank sum test/Mann–Whitney test. P‐values for each pairwise comparison are indicated in the plot. Additional statistical results for all compounds included in the analysis as well as sample size for all compared groups are reported in Tables S10 and S11. (B) Heatmap graphically presenting the pairwise correlation between the CPM‐log2 values of the differentially expressed genes and the AUC distribution of compounds identified as differentially potent across female and male FLT3‐ITD‐positive samples. The heatmap represents the correlation coefficient. Only statistically significant correlations are plotted.
