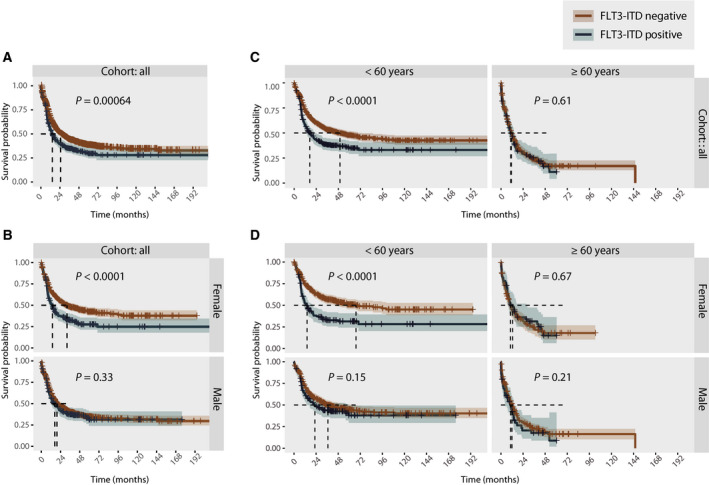
Fig. 4.

(A) Kaplan–Meier curve comparing the outcome of FLT3‐ITD‐mutated (n = 382) and non‐FLT3‐ITD‐mutated (n = 1178) patients across the four cohorts analysed together. (B) Kaplan–Meier curve comparing the outcome of FLT3‐ITD‐mutated and non‐FLT3‐ITD‐mutated patients analysed across the four cohorts but analysed individually for females (FLT3‐ITD negative n = 523; FLT3‐ITD positive n = 198) and males (FLT3‐ITD negative n = 655; FLT3‐ITD positive n = 184). (C) Kaplan–Meier curve comparing the outcome of FLT3‐ITD‐mutated and non‐FLT3‐ITD‐mutated patients across the four cohorts analysed together, separated by age (FLT3‐ITD‐negative patients: > 60 years n = 788; ≥ 60 years n = 390. FLT3‐ITD‐positive patients: > 60 years n = 278; ≥ 60 years n = 104). (D) Kaplan–Meier curve comparing the outcome of FLT3‐ITD‐mutated and non‐FLT3‐ITD‐mutated patients across the four cohorts combined, separated by sex and age (female FLT3‐ITD negative > 60 years n = 379; ≥ 60 years n = 144, female FLT3‐ITD positive > 60 years n = 143; ≥ 60 years n = 55; male FLT3‐ITD negative > 60 years n = 409; ≥ 60 years n = 246, male FLT3‐ITD positive > 60 years n = 135; ≥ 60 years n = 49). Statistical significance is evaluated using the log‐rank test. P‐values are indicated in each individual plot.
