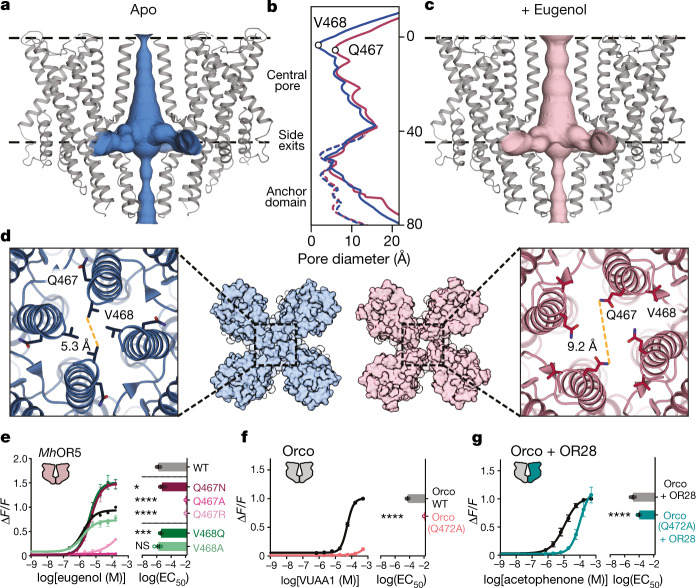
Fig. 2. Odorant-evoked opening of MhOR5.
a, c, The channel pores of the apo (a, blue) and eugenol-bound MhOR5 (c, pink). Black dashed lines, membrane boundaries. b, The diameter of the ion conduction pathway (solid lines) and along the anchor domain (dashed lines). y-axis shows distance from the outer membrane boundary towards the intracellular space in Å. d, Close-up view of the pore from the extracellular side in the apo (left, blue) and eugenol-bound (right, pink) structures. Distances between S7b residues measured from atom centres. e–g, Dose–response curves (left) and mean ± s.e.m. log(EC50) (right) for wild-type (WT), Val468 mutants and Gln467 mutants of MhOR5 (e), wild-type and Q472A mutant (homologous to Gln467 in MhOR5) of Orco as a homotetramer (f) and wild-type and Q472A mutant of Orco in heteromeric Orco–AgOR28 complex (g). Statistical significance determined using one-way ANOVA followed by Dunnett’s multiple comparison tests. For mutants for which the EC50 was incalculably high and Bartlett’s test showed non-homogenous variance, statistical significance determined with a Brown–Forsythe test. ****P < 0.0001; ***P < 0.001; *P < 0.01; NS, not significant. Supplementary Tables 2, 3 contain details including n values for all biological replicates.

