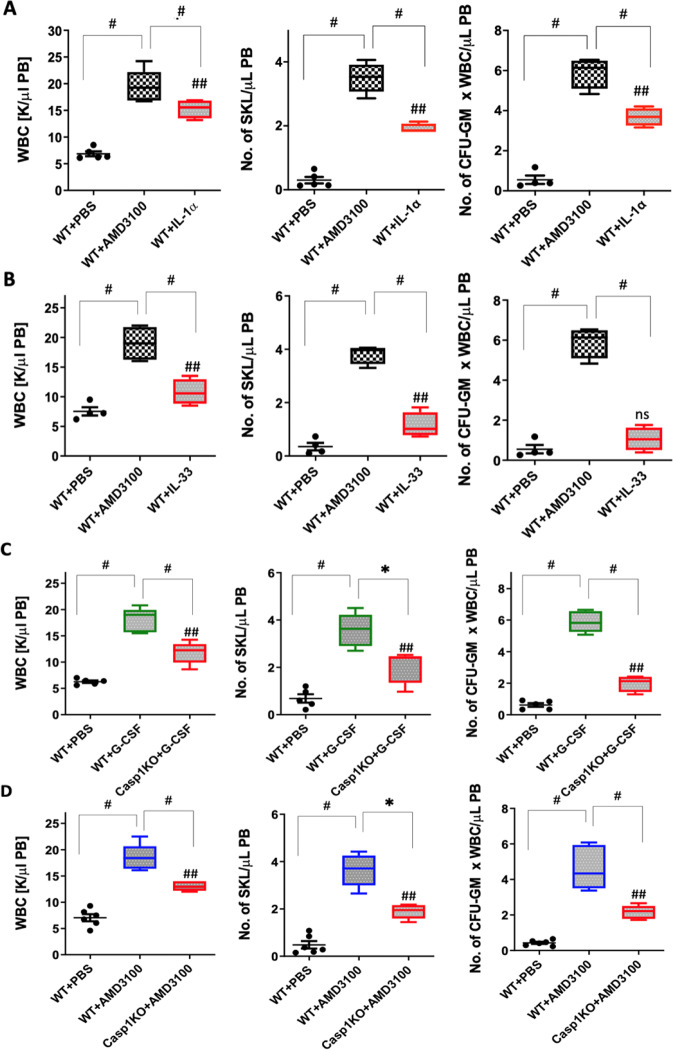
Fig. 1. G-CSF and AMD3100 mediated mobilization experiments in normal mice in response to IL-1α and IL-33 and poor G-CSF and AMD3100 mobilization in caspase-1-KO animals.
A WT mice were injected with PBS, AMD3100 (5 mg/kg), or IL-1α (1 µg/mice), and peripheral blood (PB) parameters for WBCs (left), SKL cells (middle), and CFU-GM clonogenic progenitors (right) were analyzed. B WT mice were injected with PBS, AMD3100 (5 mg/kg), or IL-33 (1 µg/mice), and PB parameters for WBCs (left), SKL cells (middle), and CFU-GM clonogenic progenitors (right) were analyzed. AMD3100, IL-1α, and IL-33 were injected once. AMD3100-injected mice were sacrificed 1 h post injection, whereas the mice that had received IL-1α or IL-33 were sacrificed 6 h post injection. To perform a CFU-GM colony assay, peripheral blood mononuclear cell (PBMNC) samples were cultured in human methylcellulose medium supplemented with growth factors. The PBMNCs were stained with appropriate antibodies, and the SKL cell population was analyzed using a flow cytometer. The number of SKL cells mobilized into PB was calculated using the formula: WBCs × SKL cells/gated WBCs = SKL cells/μl. The number of CFU-GM/μl in PB was evaluated by the formula: [WBCs] × CFU-GM colonies/WBCs plated. The data are presented as means ± SE, and an unpaired Student’s t-test was used for the determination of significance (*p ≤ 0.05, #p ≤ 0.005, and ##p ≤ 0.005 or ns no significant WT+PBS vs WT+IL-1α). C Caspase-1-KO mice are poor G-CSF and AMD3100 mobilizers. WT mice were injected with PBS or G-CSF (180 µg/kg), while caspase-1-KO (Casp1-KO) mice were injected with G-CSF (180 µg/kg), and the PB parameter profiles for WBCs (left), SKL cells (middle), and CFU-GM clonogenic progenitors (right) were analyzed. PBMNC samples were cultured for CFU-GM colonies, and stained PBMNCs were analyzed by flow cytometer for SKL cell analysis. D WT mice were injected with PBS or AMD3100 (5 mg/kg), while Casp1-KO mice were injected with AMD3100 (5 mg/kg), and the PB parameter profiles for WBCs (left), SKL cells (middle), and CFU-GM clonogenic progenitors (right) were analyzed. AMD3100 was injected once, whereas G-CSF was given on 4 consecutive days. AMD3100-injected mice were sacrificed 1 h post injection, whereas G-CSF-injected animals were sacrificed 6 h after the last injection. The numbers of SKL cells and CFU-GM progenitors mobilized into PB were calculated using the formula described in Materials and methods. The data are presented as means ± SE, and an unpaired Student’s t-test was used for the determination of significance (*p ≤ 0.05, #p ≤ 0.005, and ##p ≤ 0.005 WT+PBS vs Casp1-KO+G-CSF).

