
Figure 2.
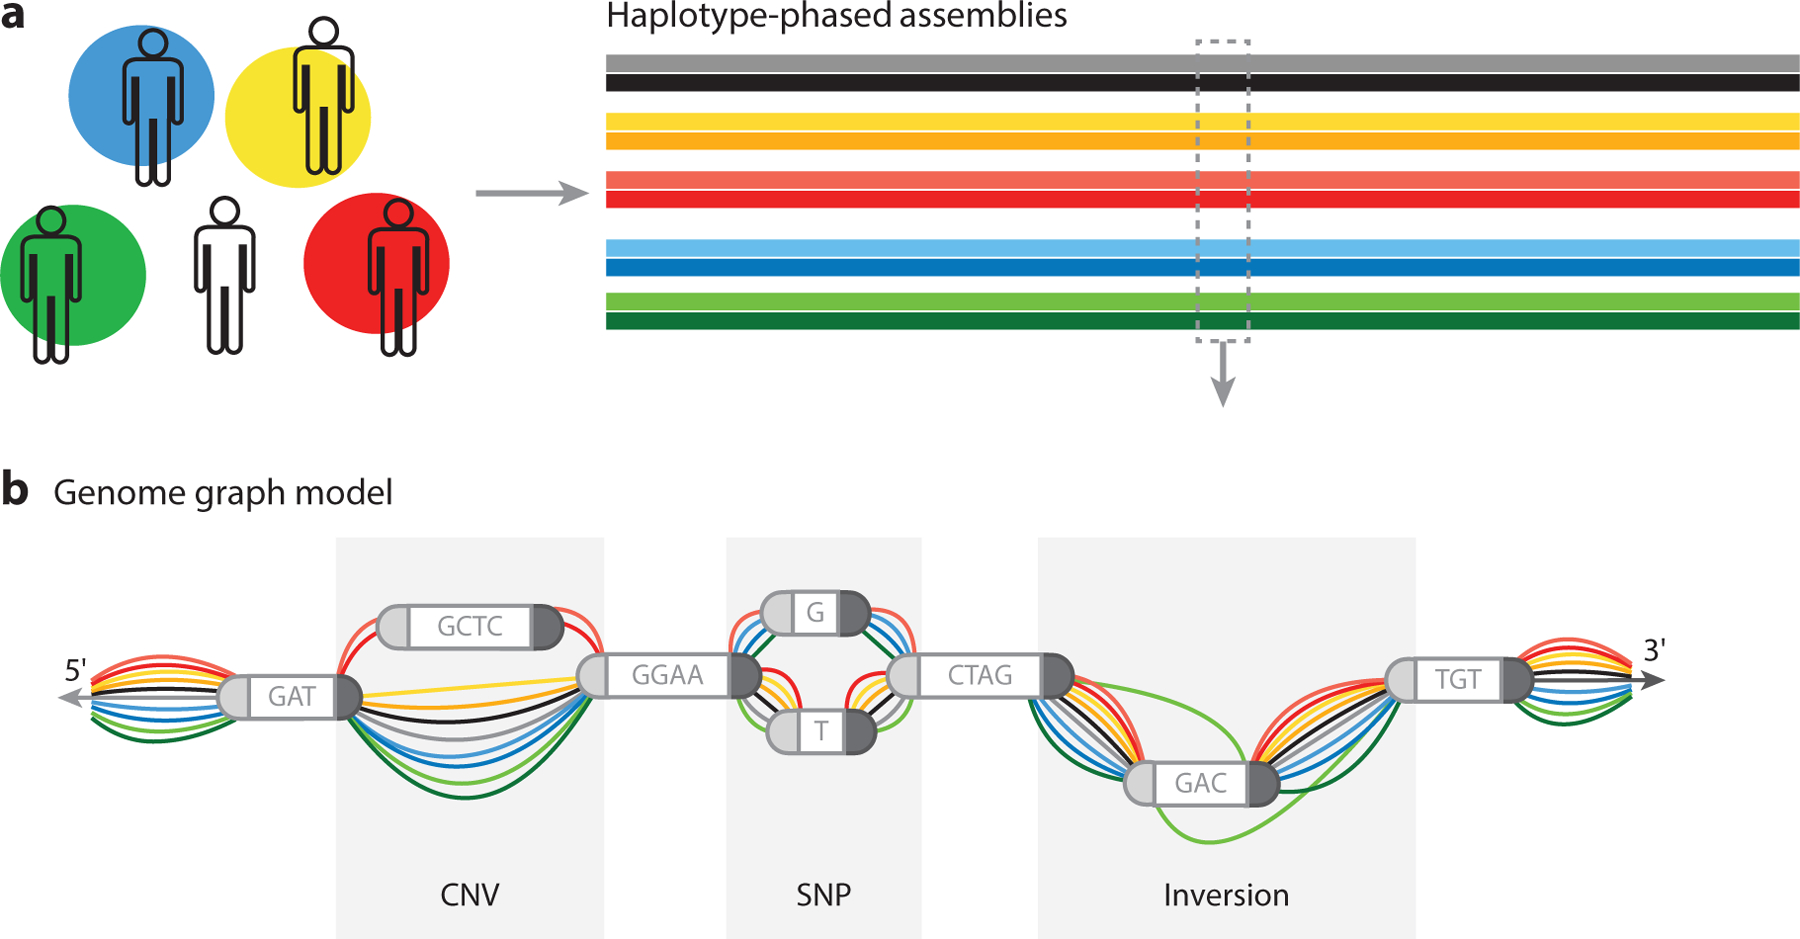
Genome graphs are useful in representing differences in genomic structure. Genomic data from a population can be organized into an edge-based sequence variation graph. (a) Consistency is important. The result of sampling from a population of diverse individuals and whole-genome sequencing is a database of haplotype-phased assemblies (ideally complete, error-free, chromosome-scale sequence assemblies) for each individual. (b) These references can be collectively studied as a graph, where nodes represent sequence information and edges describe the ordering of these sequences in each assembled haplotype. Studying these data reveals sites of copy number variants (CNVs) (regions of insertions or deletions) and sites of single-nucleotide polymorphisms (SNPs), and by creating a data structure with 5′and 3′directions, one can provide an opportunity to track inversions. In addition to reporting and representing these events, there is an opportunity to determine allelic frequency and population-based association of variants.