
Figure 3.
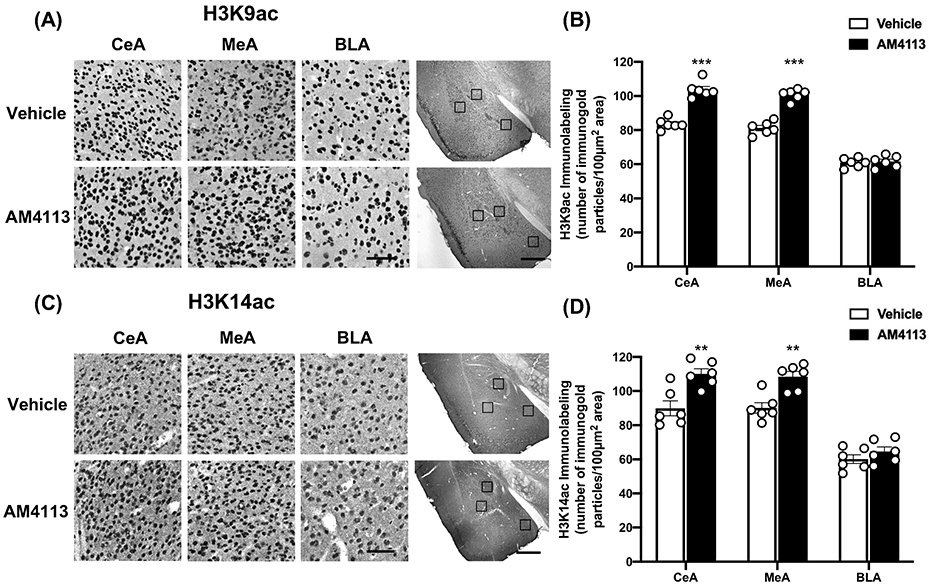
Effect of AM4113 treatment on the global protein levels of acetylated histone H3K9 (H3K9ac) and acetylated histone H3K14 (H3K14ac). (A) Representative photomicrographs of high magnification (scale bar = 50 μm) of H3K9ac gold-immunolabeling in central (CeA), medial (MeA) and basolateral (BLA) nuclei of amygdala of mice treated with either vehicle or AM4113 (1 mg/kg, i.p.). The location of these amygdaloid areas are shown by box at low magnification (scale bar = 1mm) images of amygdala of AM4113 or vehicle treated mice. (B) Bar graph shows levels of H3K9ac in CeA, MeA and BLA of AM4113 and vehicle treated mice (***p<0.001; n=6 in each group). (C) Representative photomicrographs of high magnification (scale bar = 50 μm) of H3K14ac gold-immunolabeling in CeA, MeA and BLA in mice treated with either vehicle or AM4113 (1 mg/kg). The locations of these amygdaloid areas are shown by box at low magnification (scale bar = 1mm) images of amygdala of AM4113 or vehicle treated mice. (D) Bar graph shows levels of H3K14ac in CeA, MeA and BLA following administration of AM4113 compared to vehicle group (**p<0.01; n=6 in each group). Individual values are shown with open circles and overall values are represented as mean ± SEM.