
Figure 1 |. GO-CaRT enables mapping of genome-lamina interactions in mammalian brain.
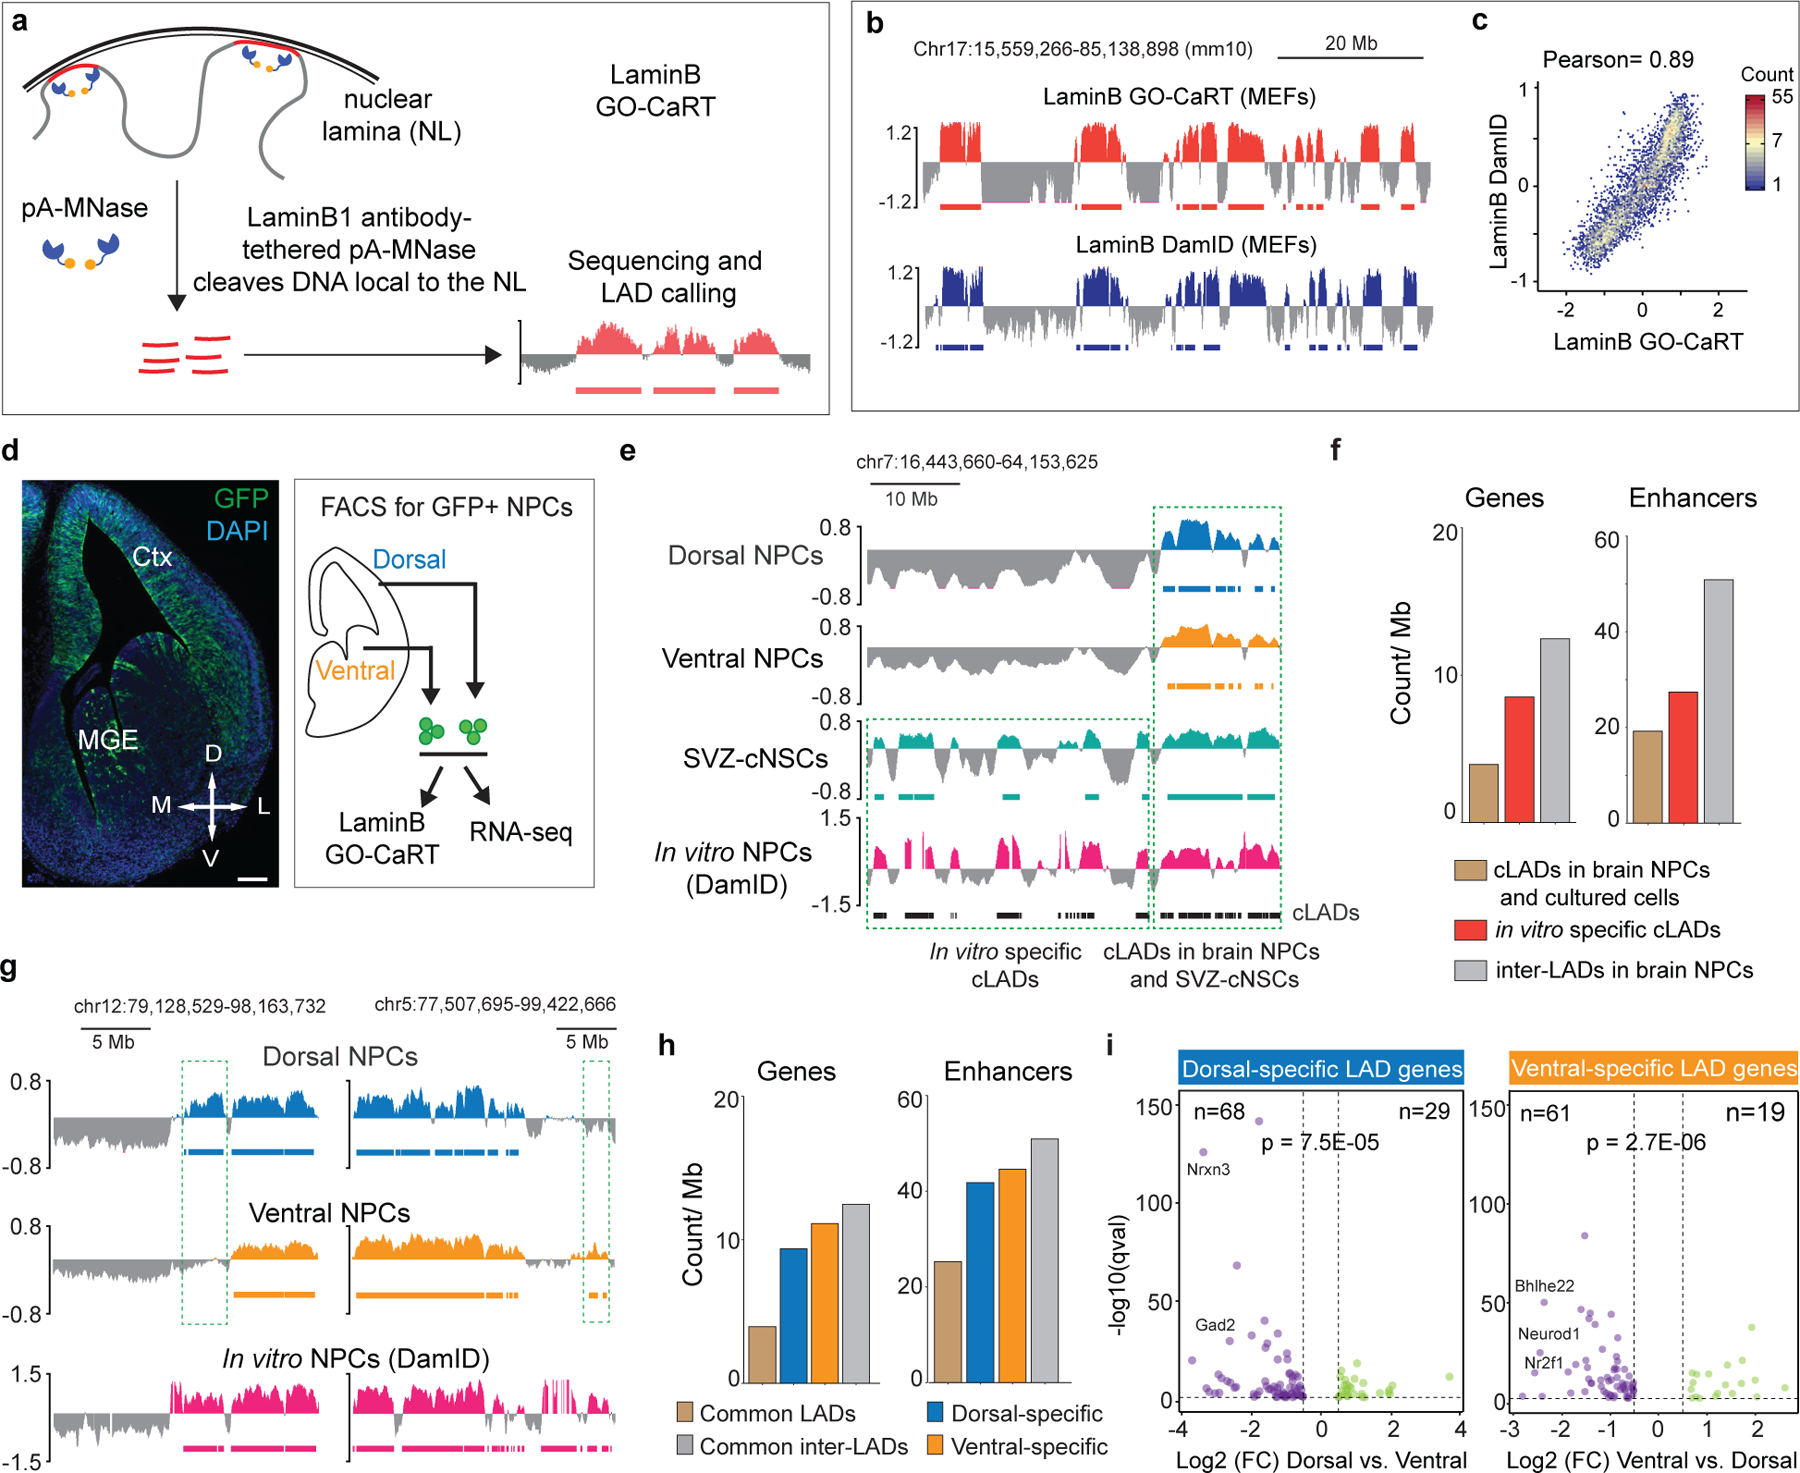
a, Schematic of LaminB GO-CaRT, wherein pA-MNase is recruited to the nuclear lamina (NL) by a LaminB1 antibody resulting in cleavage of NL proximal DNA, followed by DNA extraction, sequencing and LAD calling. b, Representative LaminB interaction profiles generated by LaminB GO-CaRT and LaminB DamID6 in 3T3 MEFs. Y-axis depict log2 ratio of LaminB over IgG (LaminB GO-CaRT) or LaminB-Dam over Dam only (DamID). LADs are depicted below traces by solid horizontal bars. c, Genome-wide scatter plot showing Pearson correlation between LaminB GO-CaRT and LaminB DamID in 3T3 MEFs. d, Coronal section of E13 mouse brain from Nes-TK-GFP mice and FACS isolation of GFP+ Nestin- (a neural stem cell marker) expressing NPCs (green) from the dorsal and ventral forebrain for LaminB GO-CaRT and RNA-seq. Ctx- Cortex; MGE- Median ganglionic eminence; Scale bar 100 μm. Similar staining was observed from two E13 brains. e, Representative LaminB GO-CaRT profiles of dorsal and ventral brain NPCs, SVZ-cNSCs and LaminB-DamID profile of in vitro NPCs (ESC-derived NPCs)6. Dashed box shows a region where some previously annotated “cLADs”6 (black horizontal bars) were not observed in brain NPCs but were detected in SVZ-cNSCs by LaminB GO-CaRT. f, Gene and enhancer density of in vitro specific cLADs, cLADs that were observed in both brain NPCs and cultured cells and inter-LADs in brain NPCs. g, Representative LaminB GO-CaRT profiles of dorsal and ventral NPCs. Dashed boxes show brain region-specific LADs. h, Gene and enhancer density in brain region-specific LADs, common LADs and inter-LADs. i, Volcano plot showing differentially expressed genes in mouse dorsal and ventral-specific LADs. Each dot represents a single gene with its differential gene expression level plotted on the x-axis and statistical significance (q-value <0.5) on y-axis. Some dorsally and ventrally important genes are indicated. p= Chi-square goodness of fit test.