
Extended Data Fig. 6. Chromatin context of active LAD genes in human cortex and H3K9me2-depleted LAD sub-domains in mouse cortex.
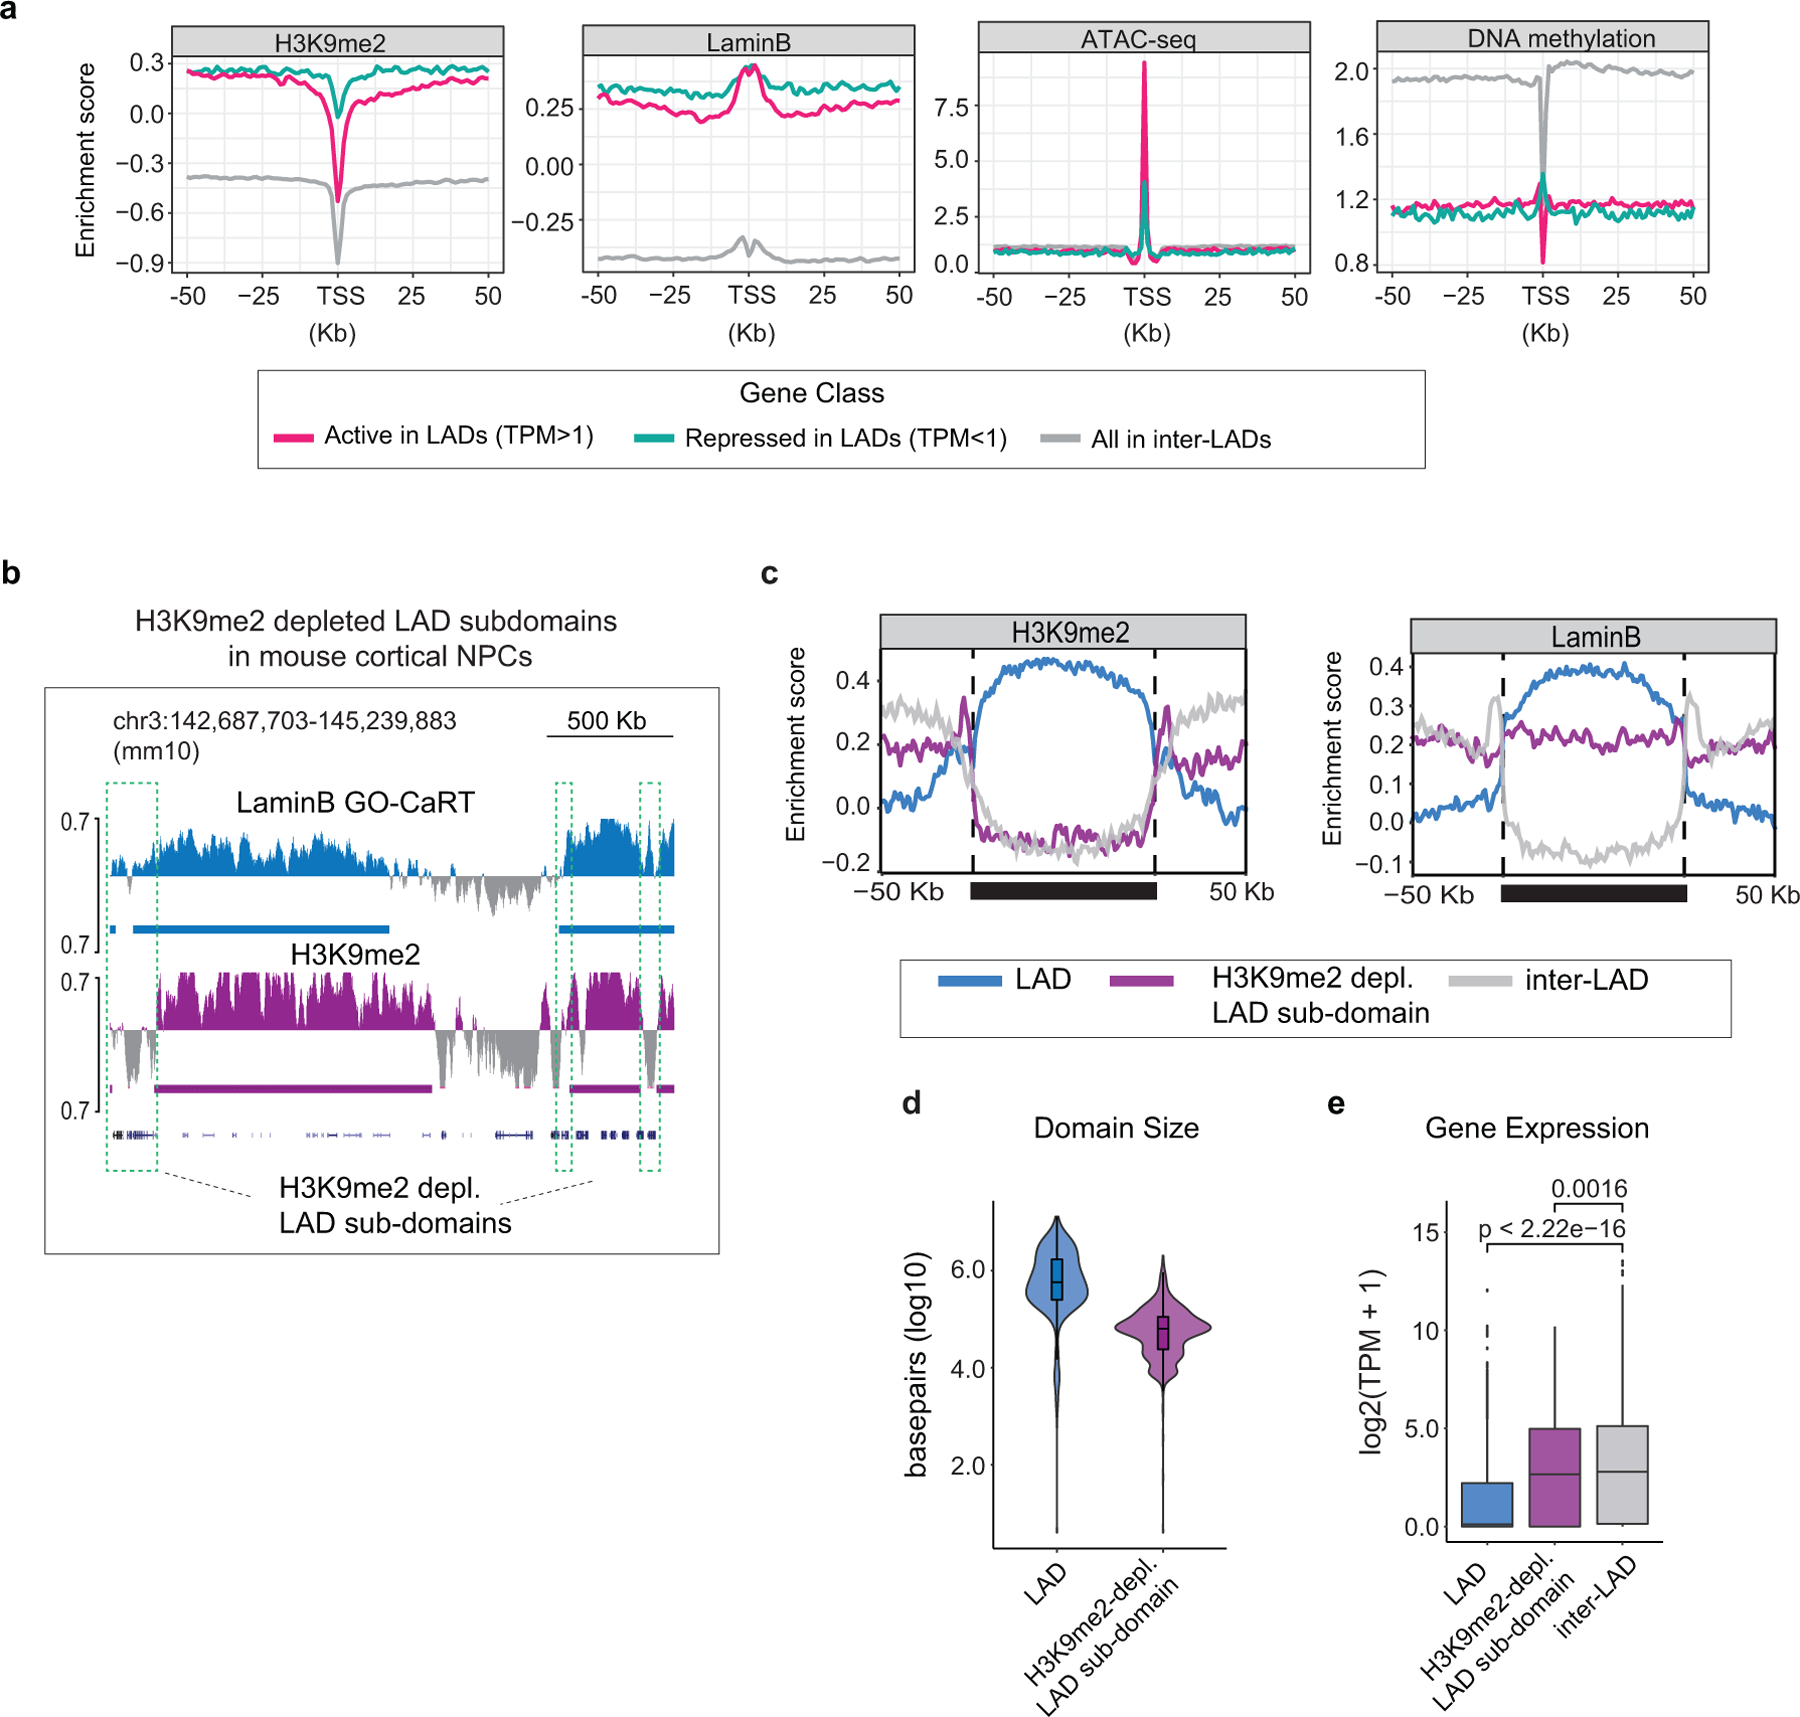
a, H3K9me2, LaminB, ATAC-seq and DNA methylation signal over TSS and surrounding regions for active genes in LADs (TPM>1, red), repressed genes in LADs (TPM<1, turquoise) and genes in inter-LADs (grey) in GW20 human cortex. b, Representative LaminB GO-CaRT tracks showing H3K9me2-depleted LAD sub-domains (marked by dashed boxes) in the mouse cortical/dorsal NPCs. c, Average H3K9me2 and LaminB signal over LADs (blue), H3K9me2-depleted LAD sub-domains (purple) and inter-LADs (grey) in mouse cortical NPCs scaled to the same relative size depicted by a solid horizontal bar. Traces in the 50Kb flanking proximal and distal regions are unscaled. d, Violin plot depicting the size in base pairs (log10) of LADs (n=743) and H3K9me2-depleted LAD sub-domains (n=664) identified in mouse cortical NPCs. e, Average gene expression in LADs (n=3546), H3K9me2-depleted LAD sub-domains (n=799) and inter-LADs (n=18442) in mouse cortical NPCs, n= number of genes. p= Wilcoxon rank sum test. Two-sided. Non-adjusted. Boxes show the range from lower (25th percentile) to upper quartiles (75th percentile), with the median line (50th percentile); whiskers extend 1.5 times the inter-quartile range from bounds of box.