
Extended Data Fig. 8. Features of neural and non-neural genes in conserved LADs.
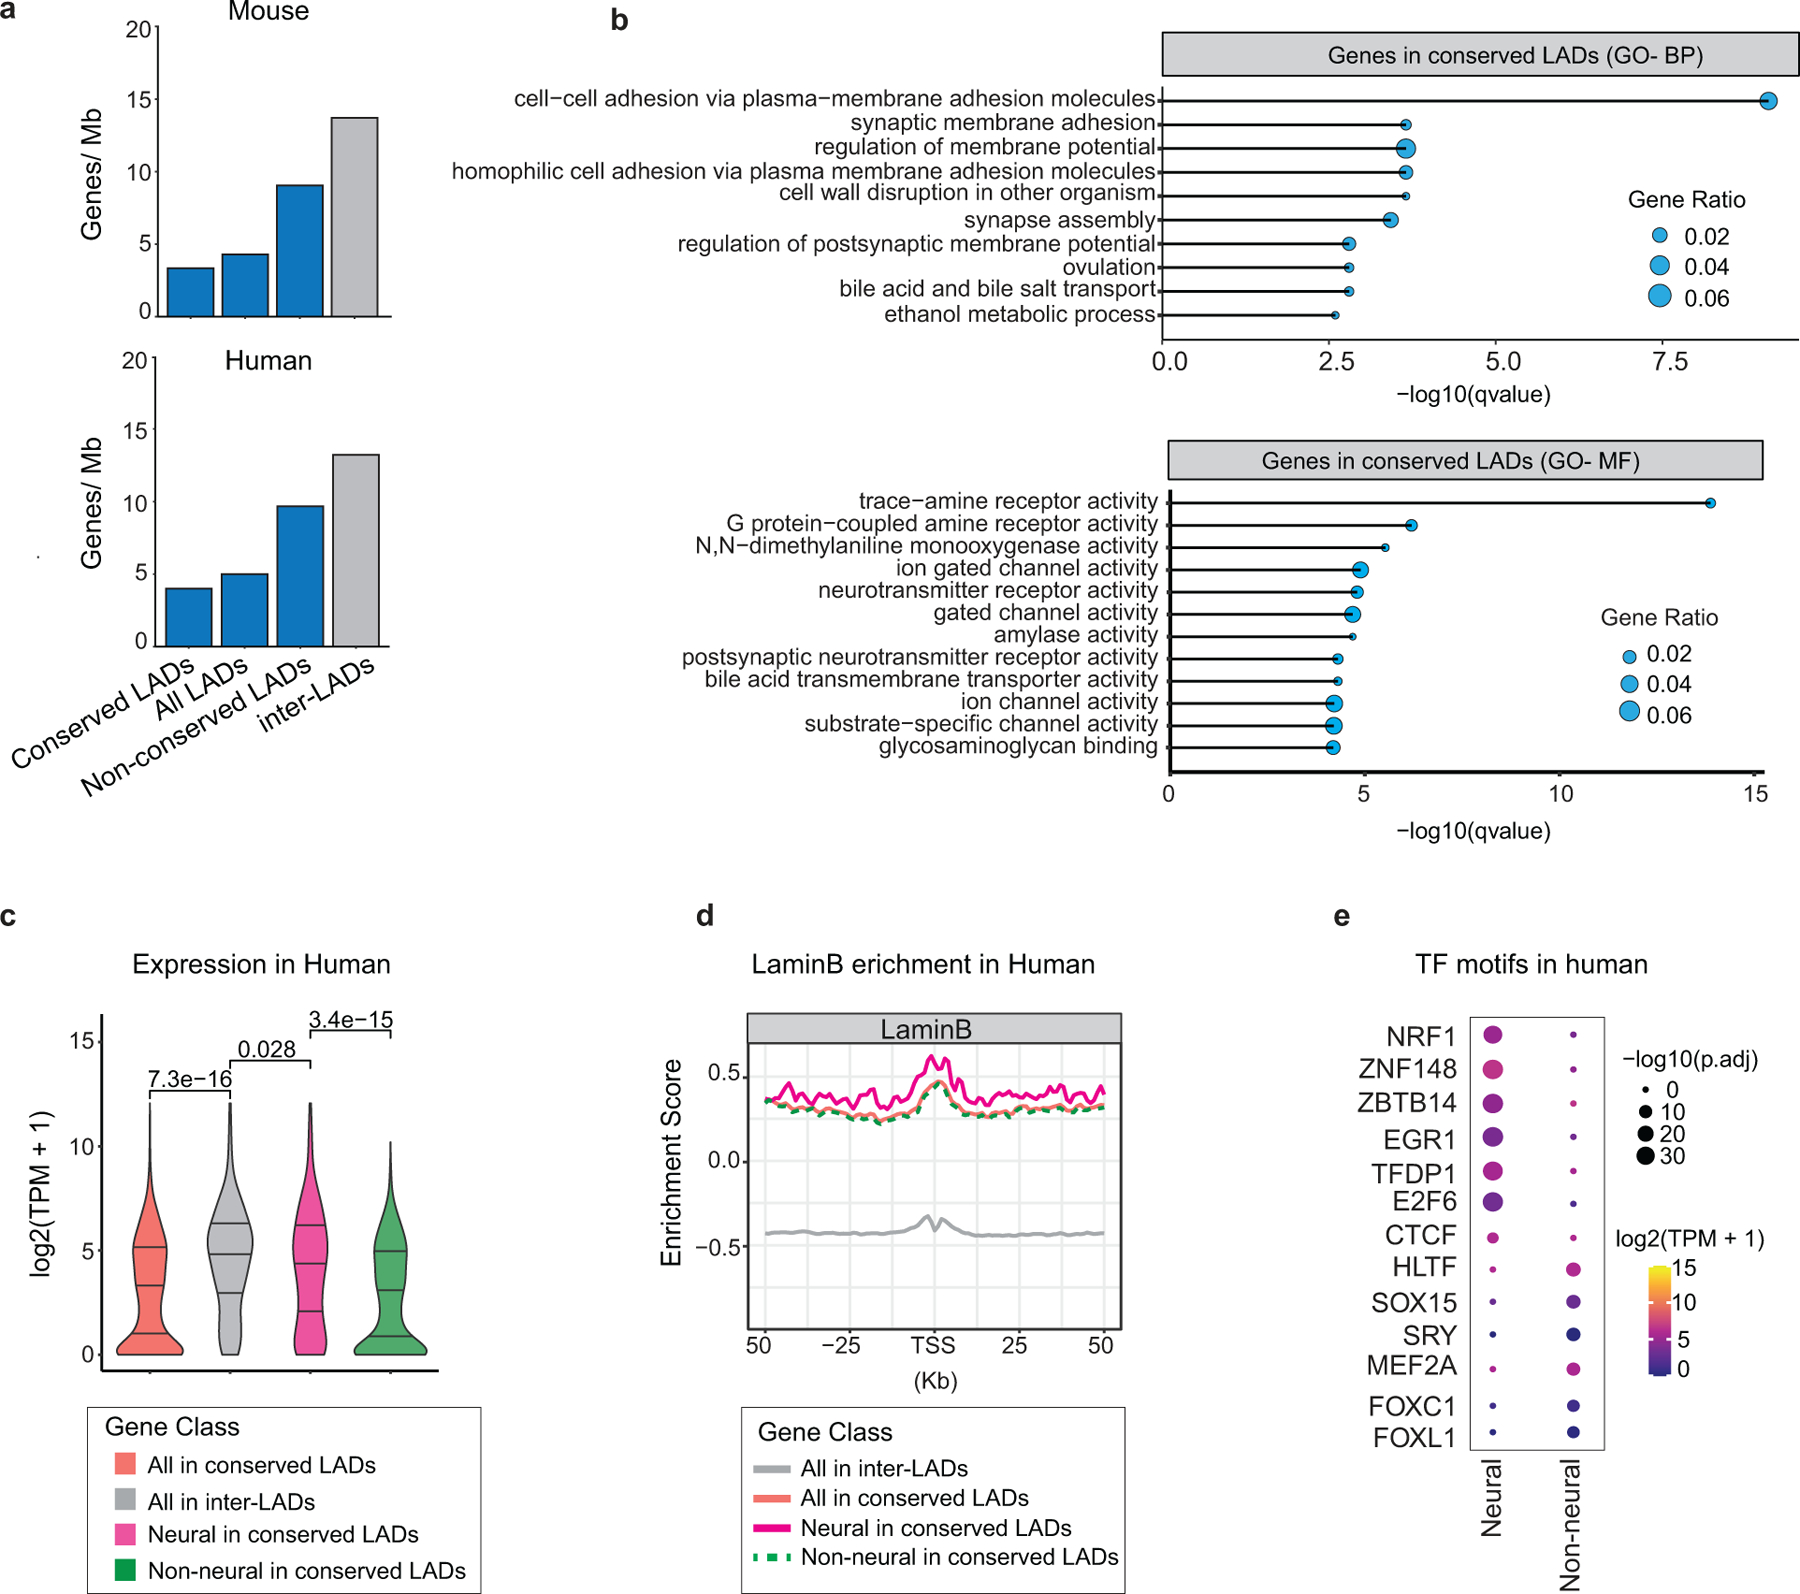
a, Gene density in conserved LADs, all LADs, non-conserved LADs and inter-LADs identified based on mouse and human liftover. b, Top enriched GO-terms of genes in conserved LADs based on mouse liftover. GO terms were sorted based on their significance, -log10(qvalue), the size of the bubble represents the gene ratio for each term. BP- Biological Process; MF- Molecular Function. c, Violin plot showing average gene expression in GW20 human cortex for all genes (red, n=1365), neural genes (pink, n=271) and non-neural genes (green, n=1094) in conserved LADs. For comparison expression is also shown for genes in inter-LADs (grey, n=17291). p= Wilcoxon rank sum test. Two-sided. Non-adjusted. d, LaminB signal (human GW20 cortex) over TSS and surrounding regions over the same gene sets as in c. e, Enriched motifs in neural and non-neural gene promoters in human. The size of the circle represents enrichment scores based on the P value from HOMER and color indicates the gene expression of the corresponding TFs in human GW20 cortex.