
Figure 2 |. LAD mapping in human brain identifies transcriptionally active, H3K9me2-depleted LAD sub-domains.
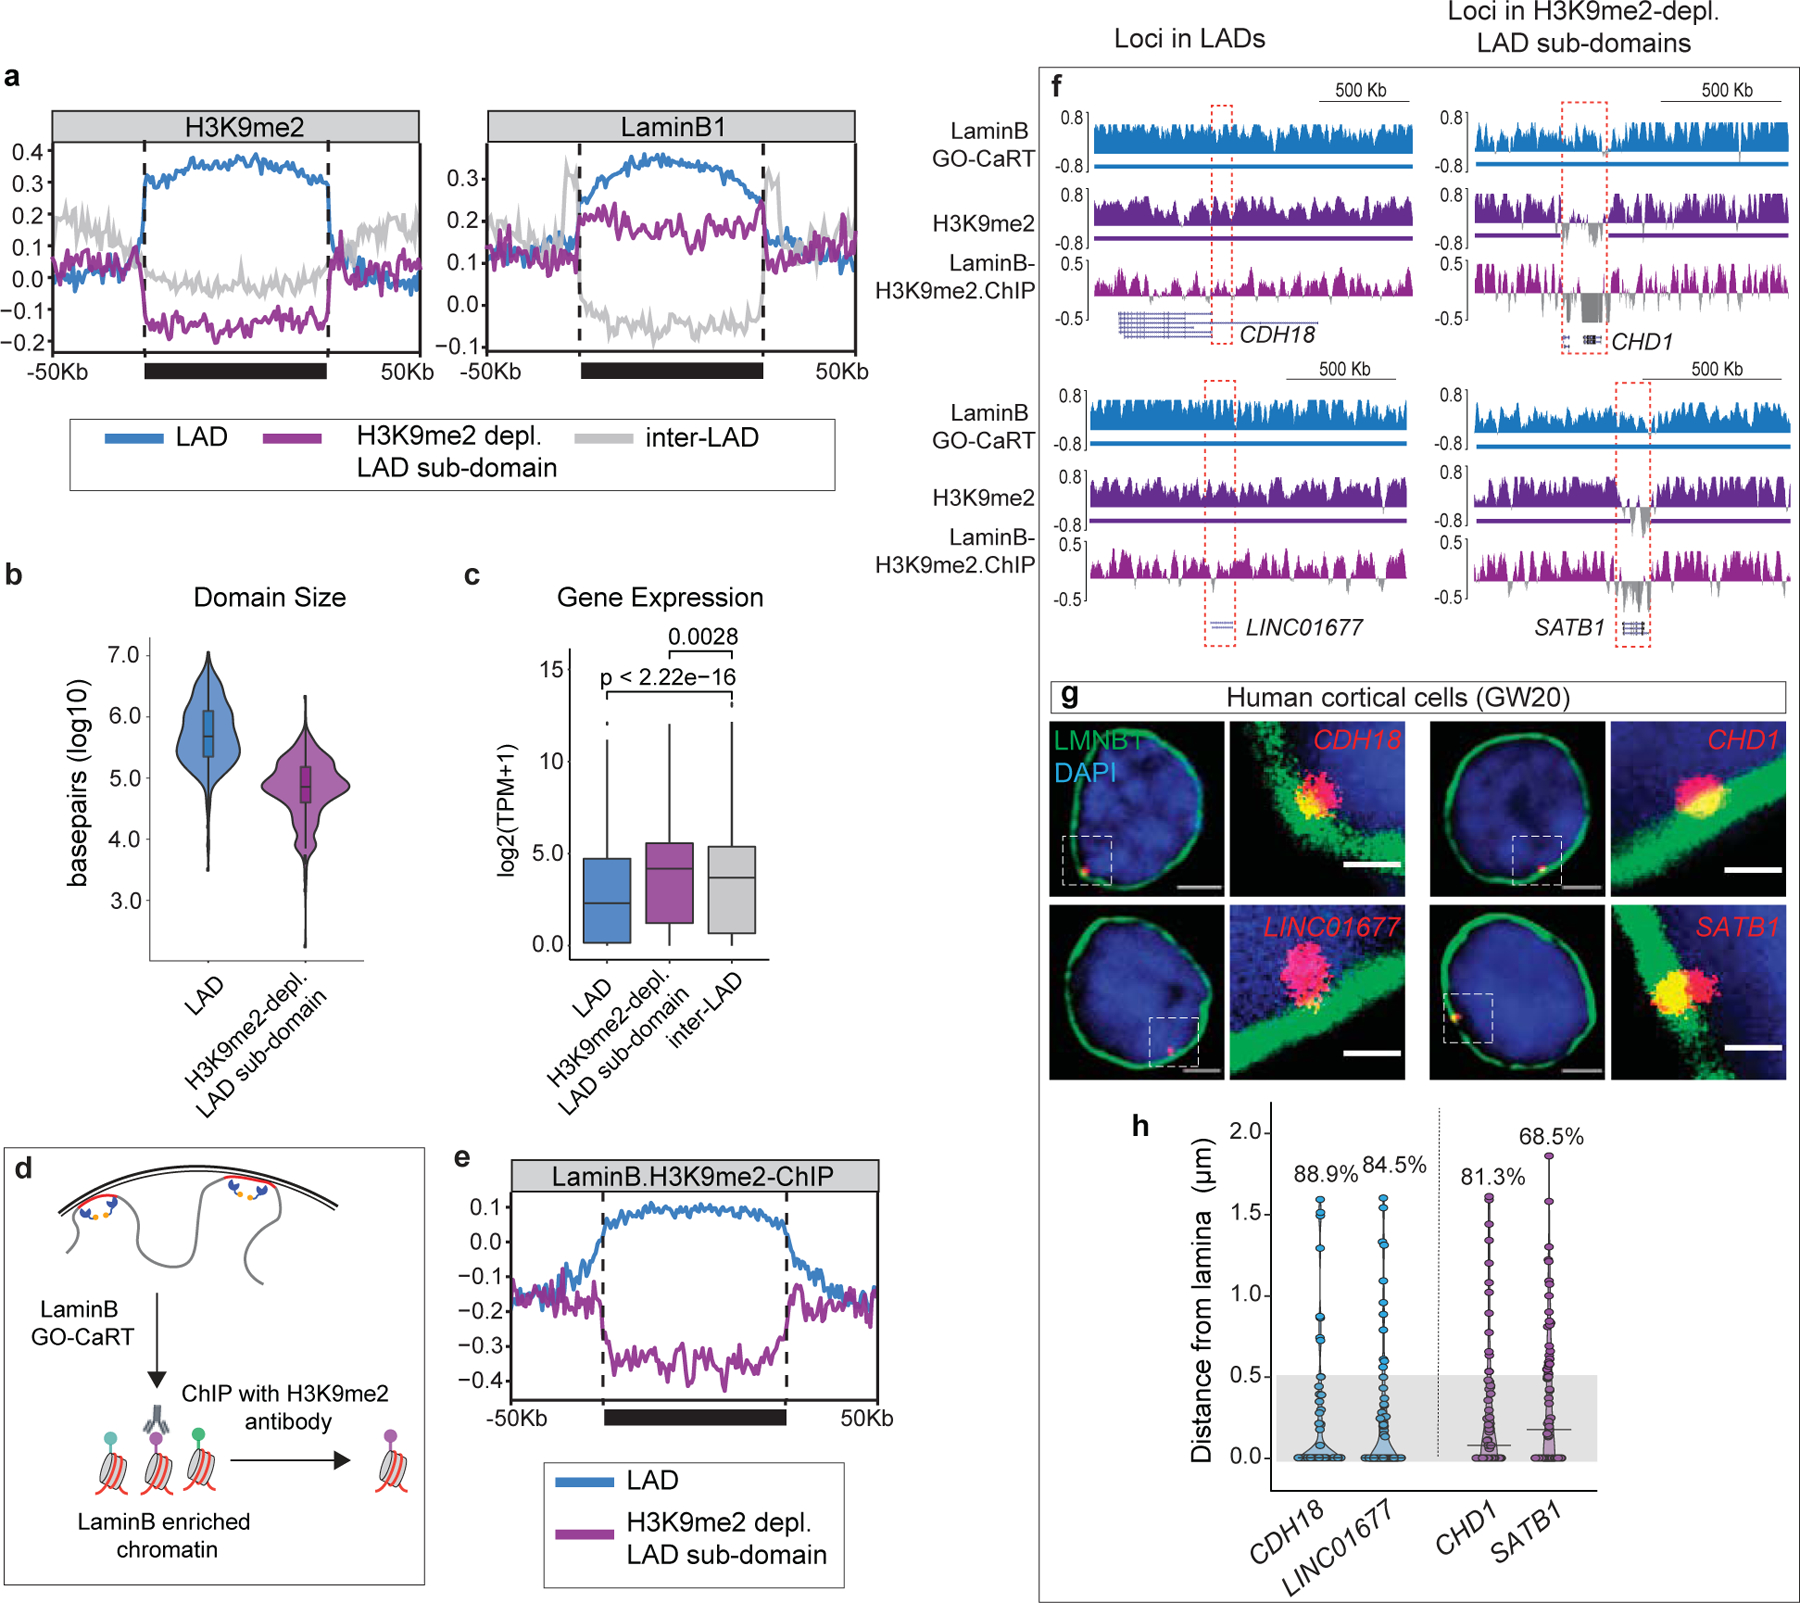
a, Average H3K9me2 and LaminB signal over LADs (blue), H3K9me2-depleted LAD sub-domains (purple) and inter-LADs (grey) scaled to the same relative size depicted by a solid horizontal bar. Traces in the 50Kb flanking proximal and distal regions are unscaled. b, Violin plot depicting the size in base pairs (log10) of LADs (n=742) and H3K9me2-depleted LAD sub-domains (n=492) identified in GW20 cortex. c, Average gene expression in LADs (n=3105), H3K9me2-depleted LAD sub-domains (n=614) and inter-LADs (n=17045), n= number of genes. p= Wilcoxon rank sum test. Two-sided. Non-adjusted. Boxes show the range from lower (25th percentile) to upper quartiles (75th percentile), with the median line (50th percentile); whiskers extend 1.5 times the inter-quartile range from bounds of box. d, Schematic of LaminB GO-CaRT.ChIP, wherein LaminB enriched chromatin is immunoprecipitated with an H3K9me2 antibody. e, Average LaminB-H3K9me2 ChIP signal over LADs and H3K9me2-depleted LAD sub-domains scaled to the same relative size depicted by a solid horizontal bar. Traces in the 50Kb flanking proximal and distal regions are unscaled. f, LaminB GO-CaRT tracks of DNA-FISH loci (marked by dashed box) located in LADs and H3K9me2-depleted LAD sub-domains. g, Representative micrographs of DNA-FISH with LaminB ICC (green) in human GW20 cortical cells for loci located in LADs (CDH18, LINC01677) and H3K9me2-depleted LAD sub-domains (CHD1, SATB1). Scale bar 2 μm, higher magnification 0.5 μm. Multiple images were taken to quantitate sub-nuclear localization of the DNA-FISH loci. h, Quantifications of DNA-FISH loci shown in g. Percentages indicate loci within 0.5 μm (grey area) from the nuclear lamina. 50–60 nuclei were quantified for each locus.