
Figure 4 |. SPADs identified in the human cortex are enriched in schizophrenia risk loci.
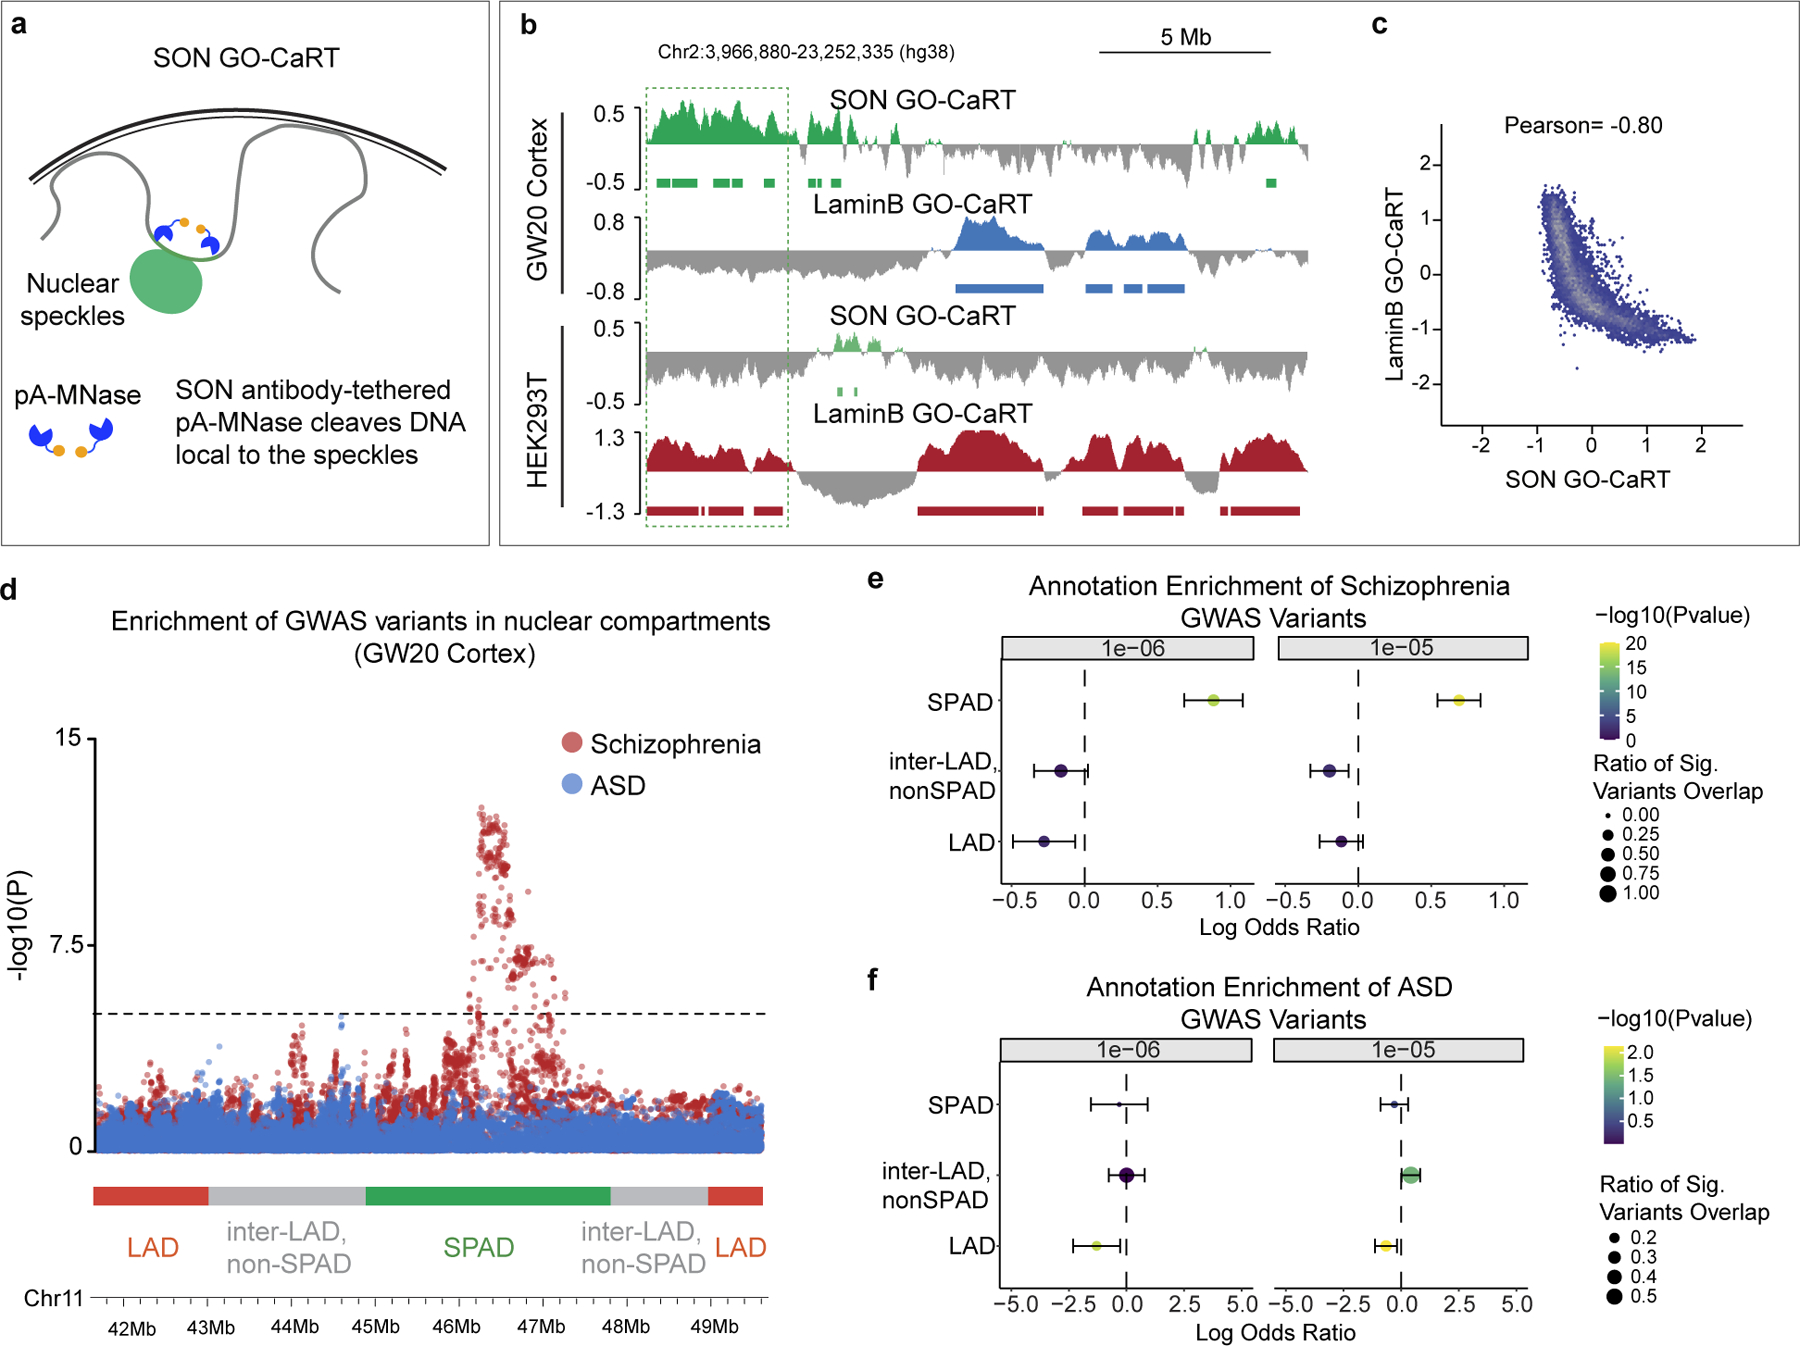
a, Schematic of SON GO-CaRT for mapping genomic regions proximal to the nuclear speckles with SON antibody. b, Representative SON GO-CaRT and LaminB GO-CaRT profiles in the GW20 human cortex and HEK293T cells. Dashed line illustrates a SPAD in human cortex that become a LAD in HEK293T cells. c, Genome-wide scatter plot showing Pearson correlation between SON GO-CaRT and LaminB GO-CaRT. d, Representative genomic region showing enrichment of GWAS risk variants for schizophrenia and ASD in nuclear compartments. Dashed line indicate threshold for statistical significance. Each circle represents a variant for SCZ (red) or ASD (blue). Red, green and grey horizontal bars represent LAD, SPAD and non-SPAD inter-LAD compartments, respectively. e-f, Log odds ratio of enrichment of significant variants overlapping a given genomic compartment with 95% confidence intervals for schizophrenia (e) or ASD (f) GWAS, where significant variants are defined as having a GWAS summary statistic of P < 1e-6 (left) or P < 1e-5 (right). Size of circle represents the fraction of significant variants overlapping a genomic compartment. Wald Test. Two-sided. Non-adjusted. Bars represent standard error. LAD, n=704, SPAD, n=1047, inter-LAD, non-SPAD, n=1810.