
Extended Data Fig. 1. Gene expression and chromatin features of LADs identified by GO-CaRT in 3T3 MEFs.
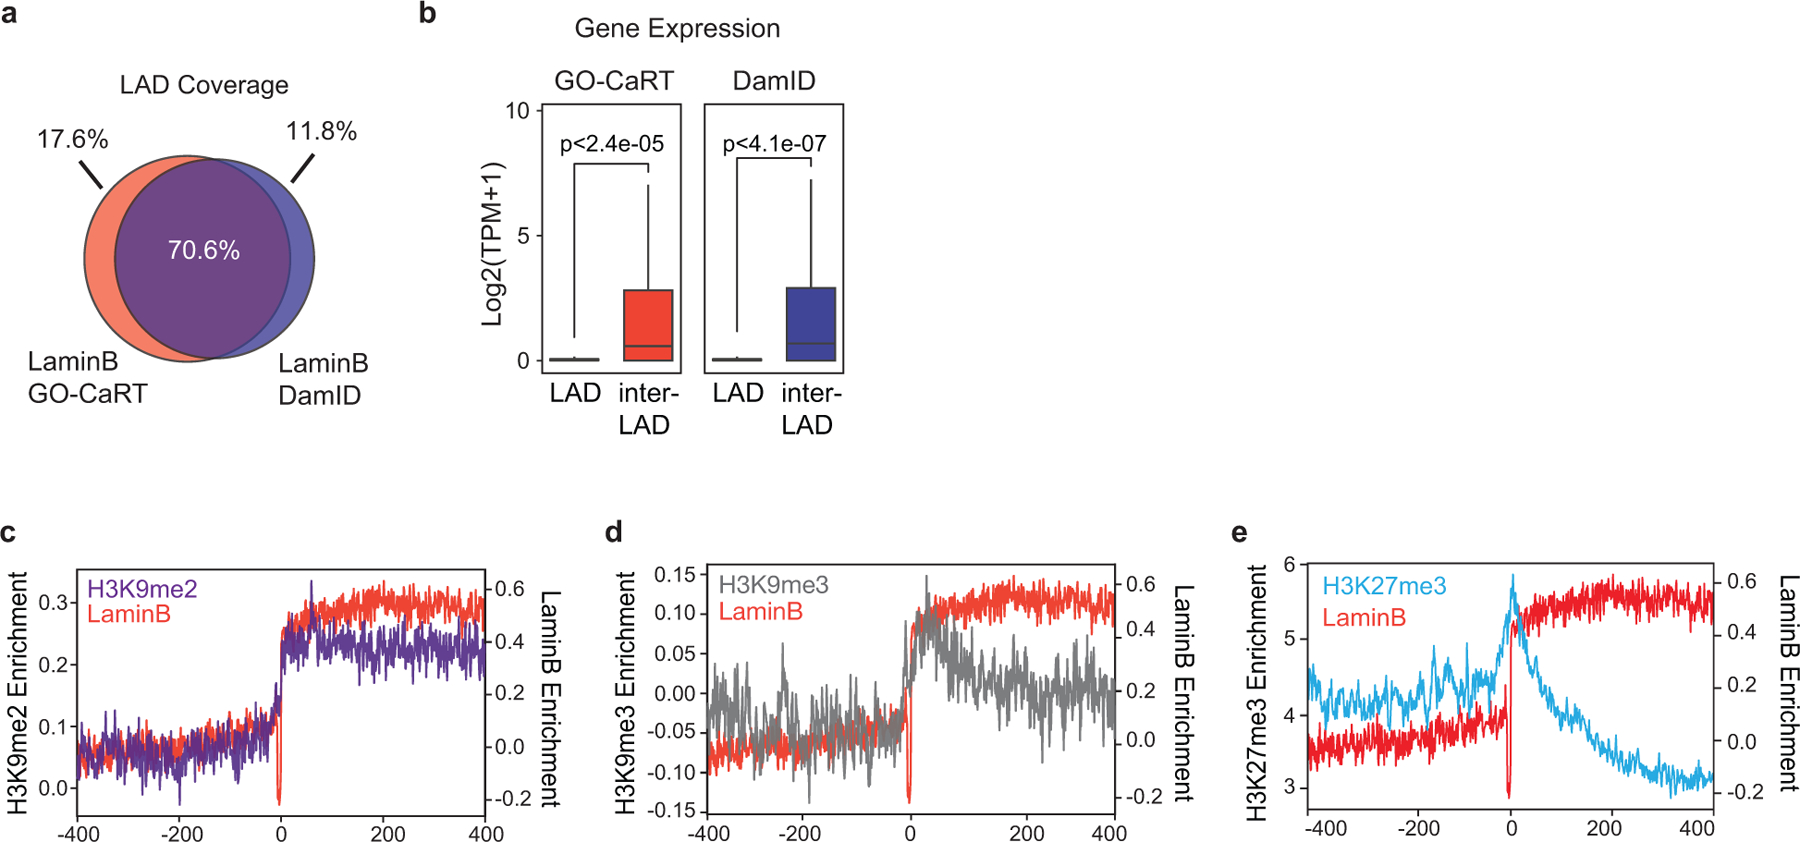
a, Venn diagram showing percent overlap of LAD coverage between GO-CaRT and DamID in MEFs. b, Box and whiskers plot depicting average gene expression (RNA-seq- SRX803943, SRX803944) in LADs and inter-LADs defined by GO-CaRT and DamID in MEFs. p= Two-tailed student’s t-test. GO-CaRT LADs, n=4390, inter-LADs, n=30499; DamID LADs, n=5313, inter-LADs, n=29576, n= number of genes. Boxes show the range from lower (25th percentile) to upper quartiles (75th percentile), with the median line (50th percentile); whiskers extend 1.5 times the inter-quartile range from bounds of box. c-e, Average H3K9me2 (c), H3K9me3 (d) and H3K27me3 (e) signal over LADs and flanking regions (400 Kb). Average LaminB signal (red) is also shown in each plot.