
Extended Data Fig. 2. Gene density and expression in LADs identified in mouse brain NPCs in vivo.
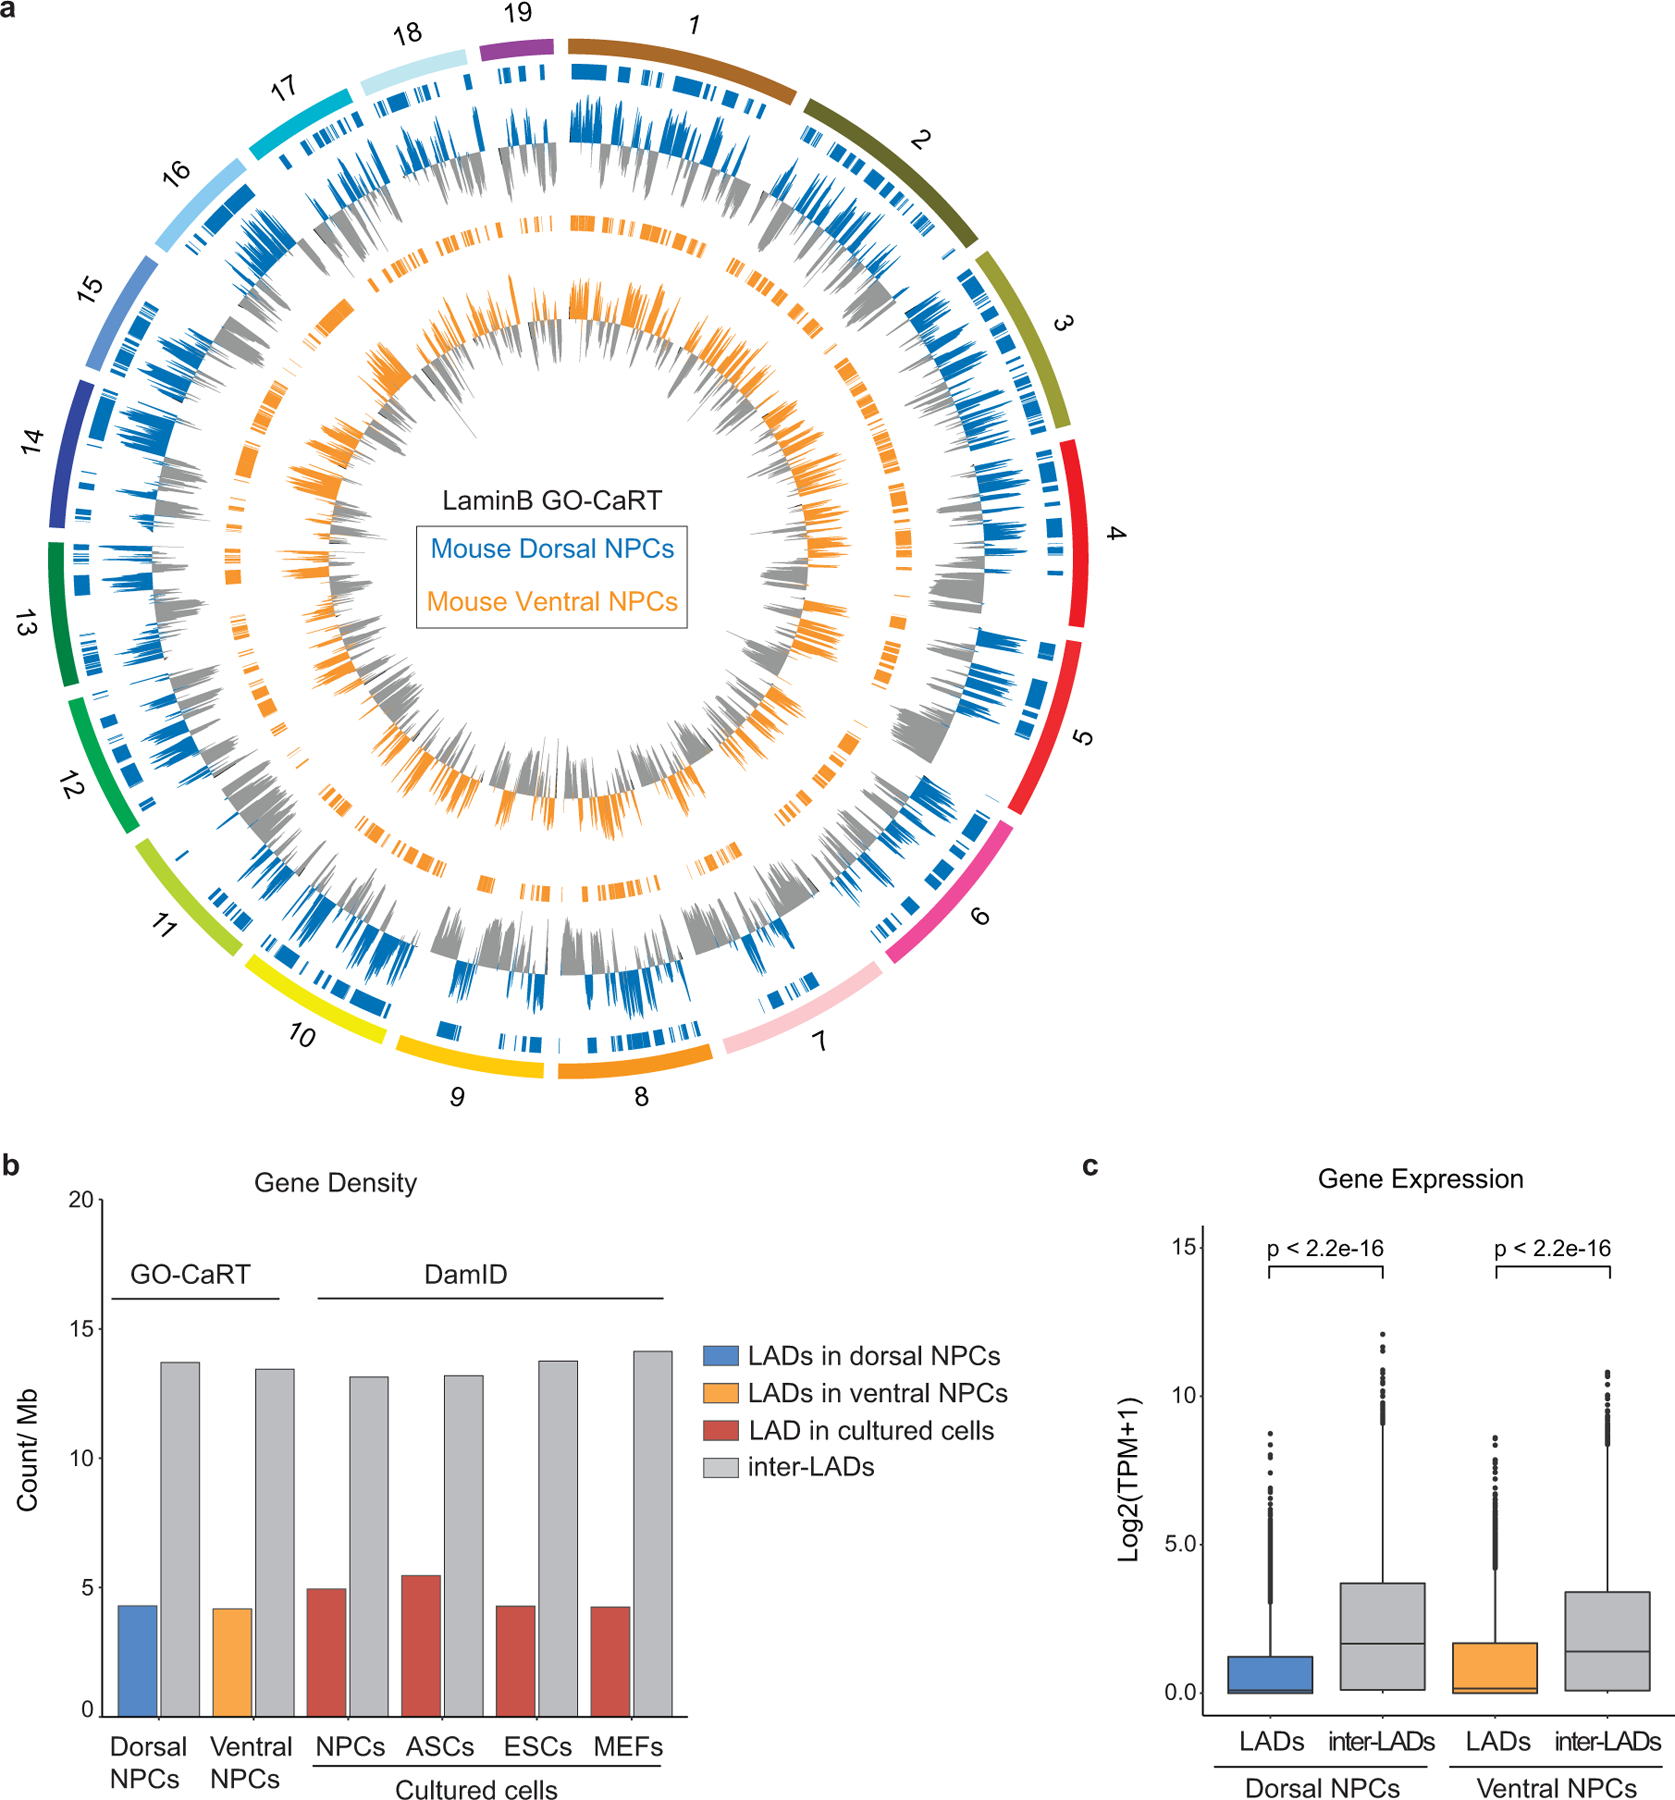
a, Circos plot showing LaminB enrichment and LADs (horizontal bars) across the mouse chromosomes (1–19) in dorsal and ventral NPCs. b, LAD and inter-LADs gene density in brain NPCs (GO-CaRT) and indicated cultured cell lines (DamID). ASCs, astrocytes., ESCs, embryonic stem cells. c, Box plot depicting average gene expression in LADs (dorsal, n=3683; ventral, n= 3520) and inter-LADs (dorsal, n=18849; ventral, n=19014) as determined by RNA-seq in dorsal and ventral NPCs, n= number of genes. p= Two-tailed students t-test. Boxes show the range from lower (25th percentile) to upper quartiles (75th percentile), with the median line (50th percentile); whiskers extend 1.5 times the inter-quartile range from bounds of box.