
Extended Data Fig. 3. Comparison of in vitro and in vivo identified LADs.
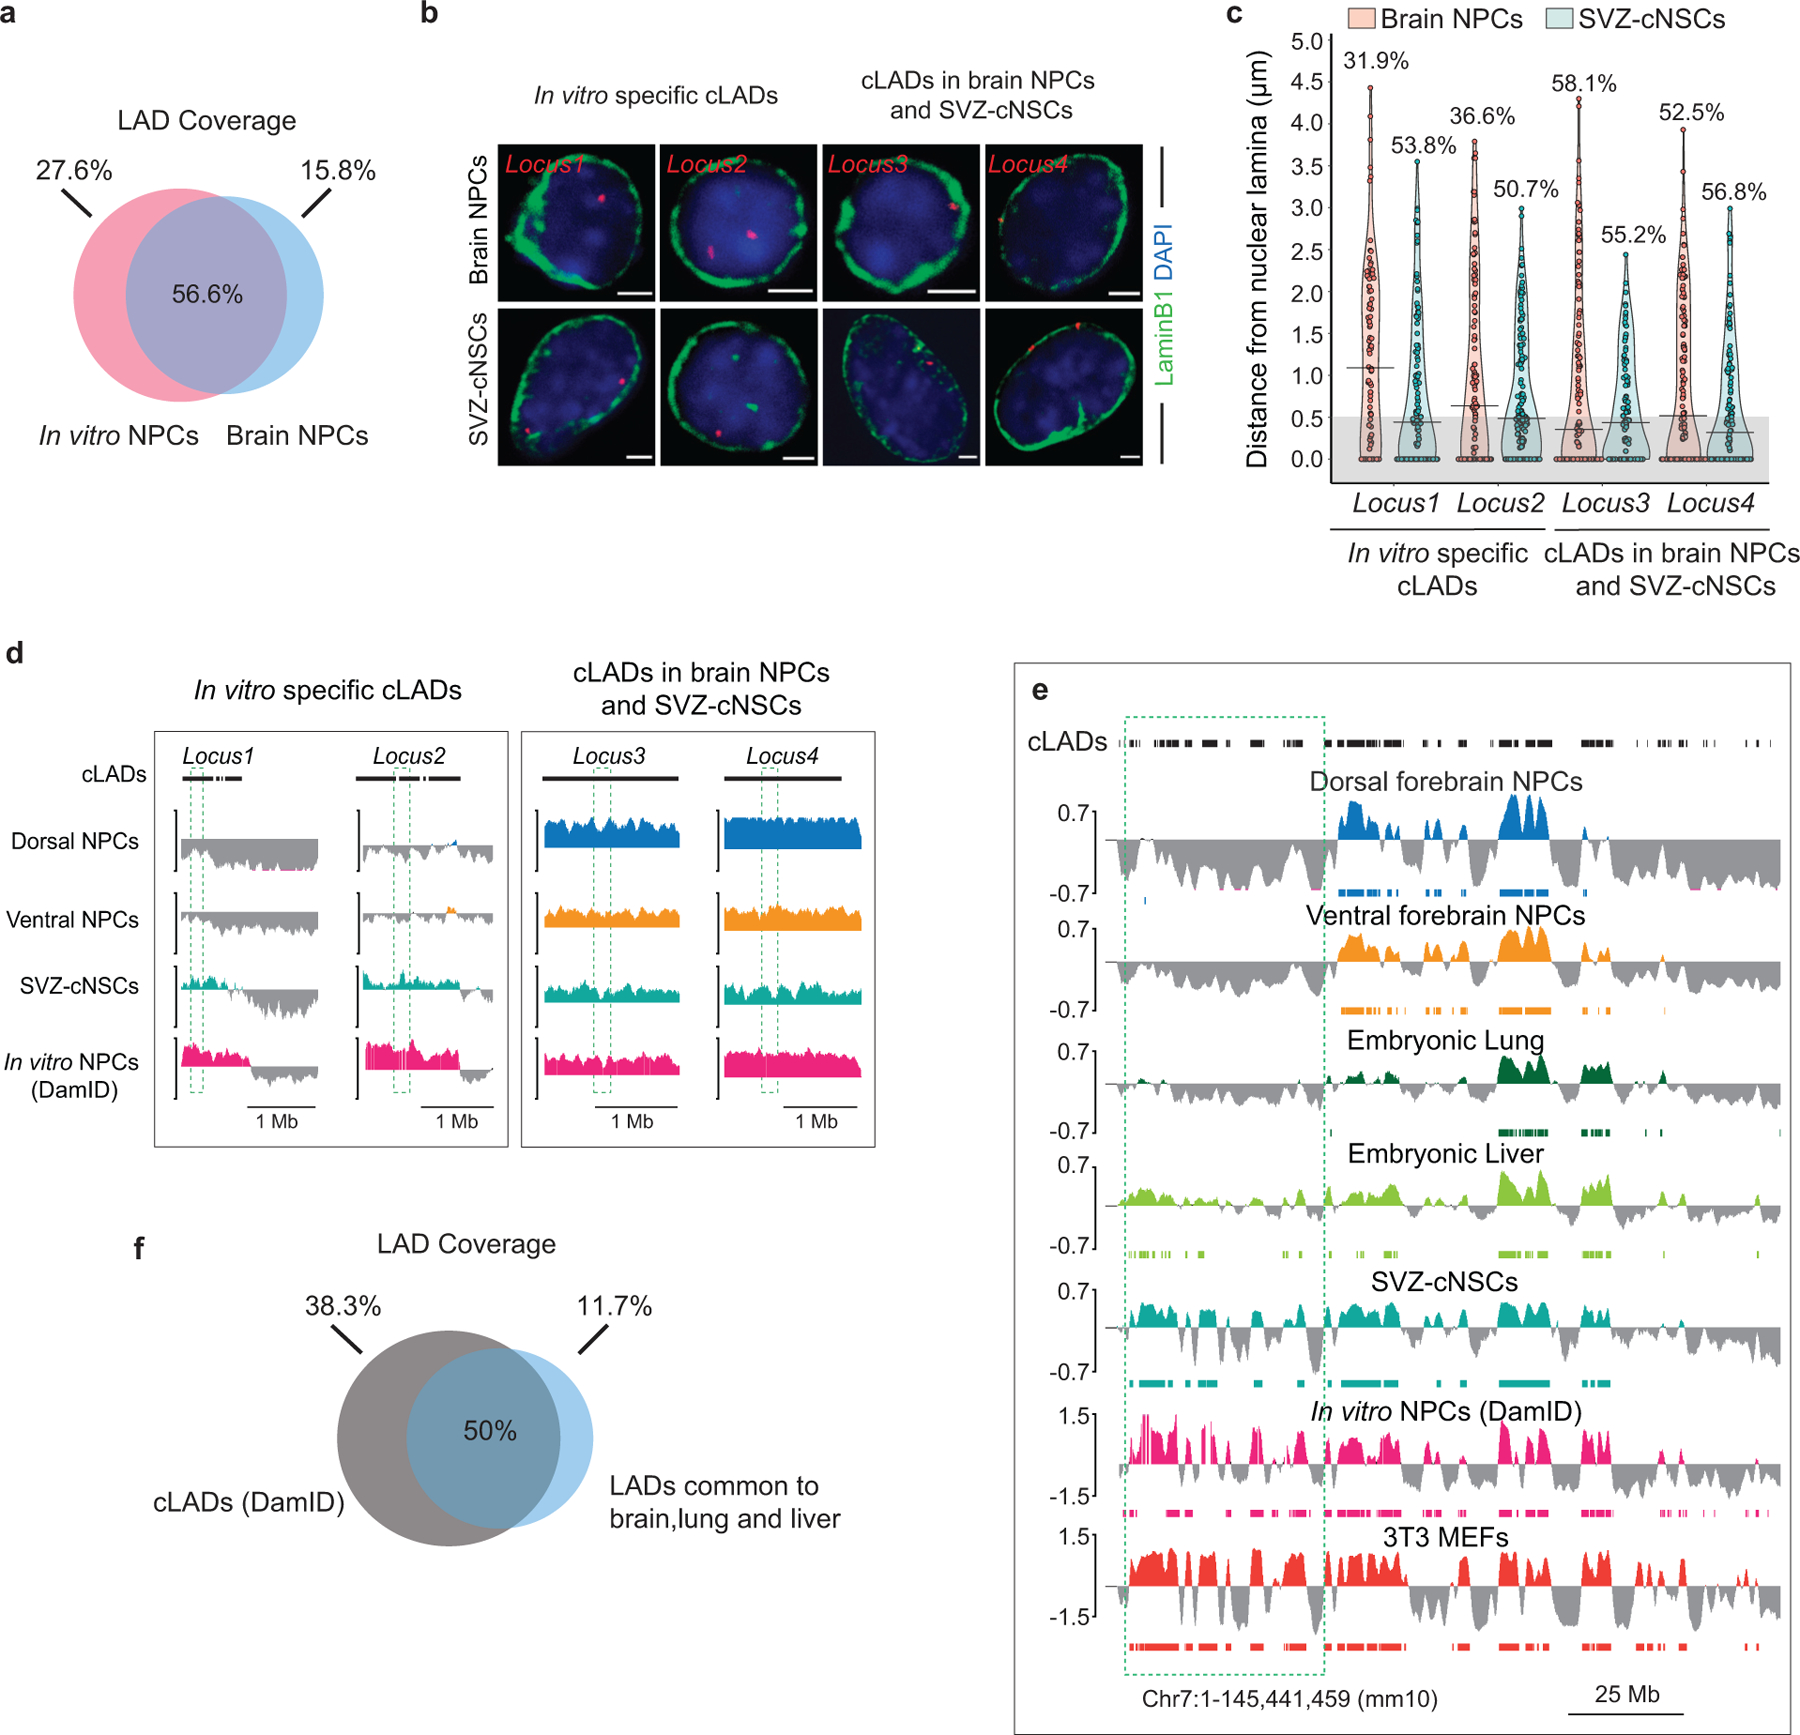
a, Venn diagram showing percent overlap of LAD coverage between brain NPCs and in vitro NPCs (DamID). b, Representative micrographs of DNA-FISH (red) with LaminB ICC (green) in brain NPCs and SVZ-cNSCs for four loci previously annotated as cLADs. Scale bar 2 μm. Multiple images were taken to quantitate sub-nuclear localization of the DNA-FISH loci. c, Quantifications of DNA-FISH for loci shown in b. Percentages indicate loci within 0.5 μm (grey area) from the nuclear lamina. 50–60 nuclei were quantified for each locus. d, LaminB GO-CaRT tracks in brain NPCs, SVZ-cNSCs and in vitro NPCs (DamID) over cLAD DNA-FISH loci (dashed box) shown in b. e, LaminB GO-CaRT tracks of brain NPCs, E13 lung, E13 liver, SVZ-cNSCs and 3T3 MEFs. In vitro NPC and cLAD track (shown on top) are DamID derived6. Dashed box indicates a region where some previously annotated “cLADs” are not observed in tissues in vivo but detected by GO-CaRT in SVZ-NSCs and 3T3 MEFs. f, Venn diagram showing percent overlap of LAD coverage between cLADs and LADs common to brain, lung and liver.