
Extended Data Fig. 4. Regional differences in LAD architecture of mouse brain NPCs.
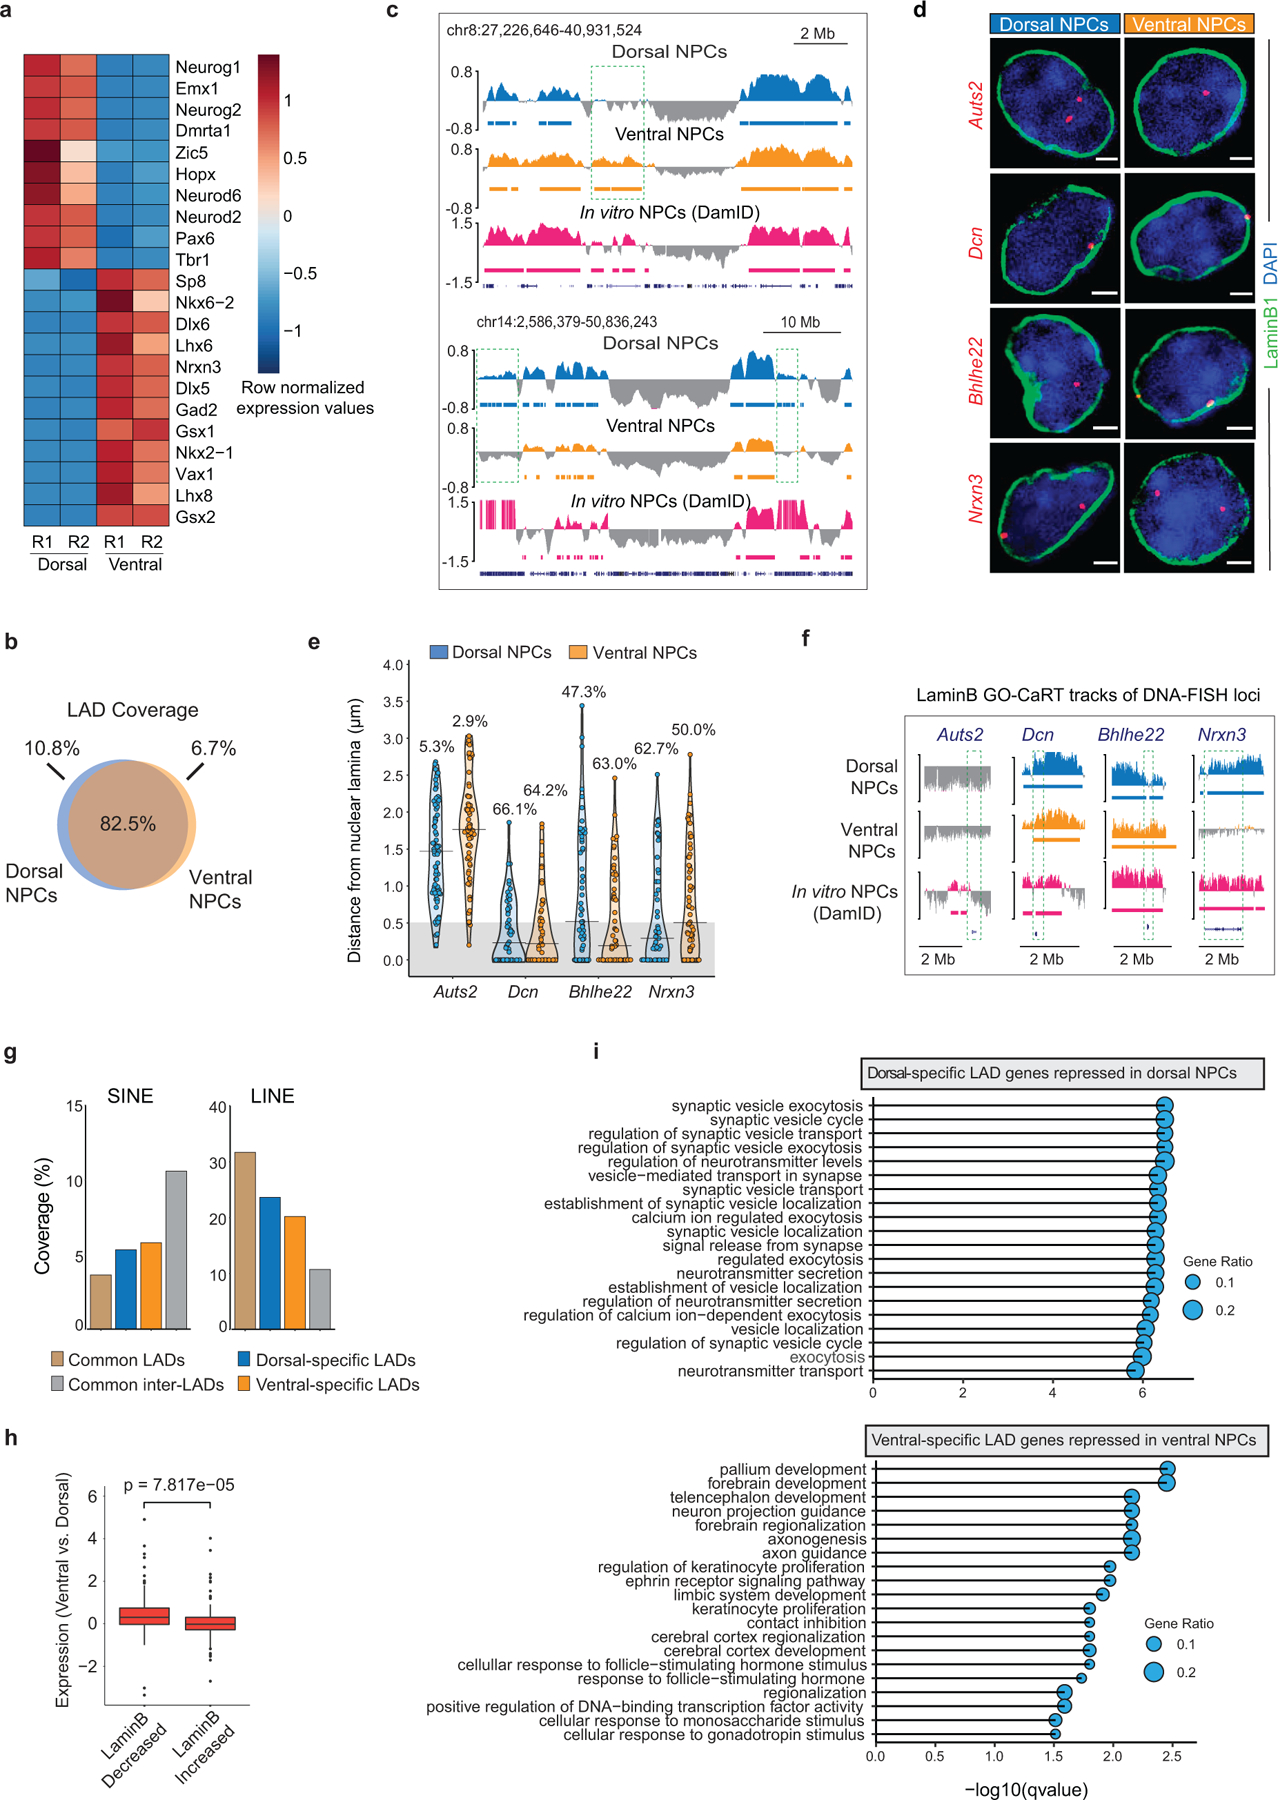
a, Heatmap showing gene expression differences (row normalized) of marker genes in dorsal and ventral regions of the E13 mouse forebrain. R1 and R2 indicate two biological replicates. b, Venn diagram showing percent overlap of LAD coverage between dorsal and ventral NPCs. c, LaminB GO-CaRT tracks showing additional examples of brain region-specific LADs (dashed boxes). d, DNA-FISH micrographs of indicated loci in dorsal and ventral NPCs. Nuclear lamina is marked by LaminB1 staining (green). Scale bar 2 μm. Multiple images were taken to quantitate sub-nuclear localization of the DNA-FISH loci. e, Quantifications of DNA-FISH for the loci shown in c. Percentages indicate loci within 0.5 μm (grey area) from the nuclear lamina. 50–60 nuclei were quantified for each locus. f, LaminB GO-CaRT tracks in brain NPCs and in vitro NPCs (DamID) over DNA-FISH loci (dashed boxes) shown in d. g, Percent coverage of SINE and LINE repeat elements in brain region-specific LADs, common LADs and inter-LADs. h, Box plot depicting differential expression of genes that have quantitative differences in LaminB enrichment (top 20 percentile) between ventral vs. dorsal NPCs. LaminB decreased, n=150, LaminB increased, n=150. p= Two-tailed students t-test. Boxes show the range from lower (25th percentile) to upper quartiles (75th percentile), with the median line (50th percentile); whiskers extend 1.5 times the inter-quartile range from bounds of box. i, Top enriched GO-terms (biological process) of differentially expressed genes in dorsal- and ventral-specific LADs. GO terms were sorted based on their significance, -log10(qvalue), the size of the bubble represents the gene ratio for each term.