
Extended Data Fig. 5. Regional differences in LAD architecture of human brain NPCs.
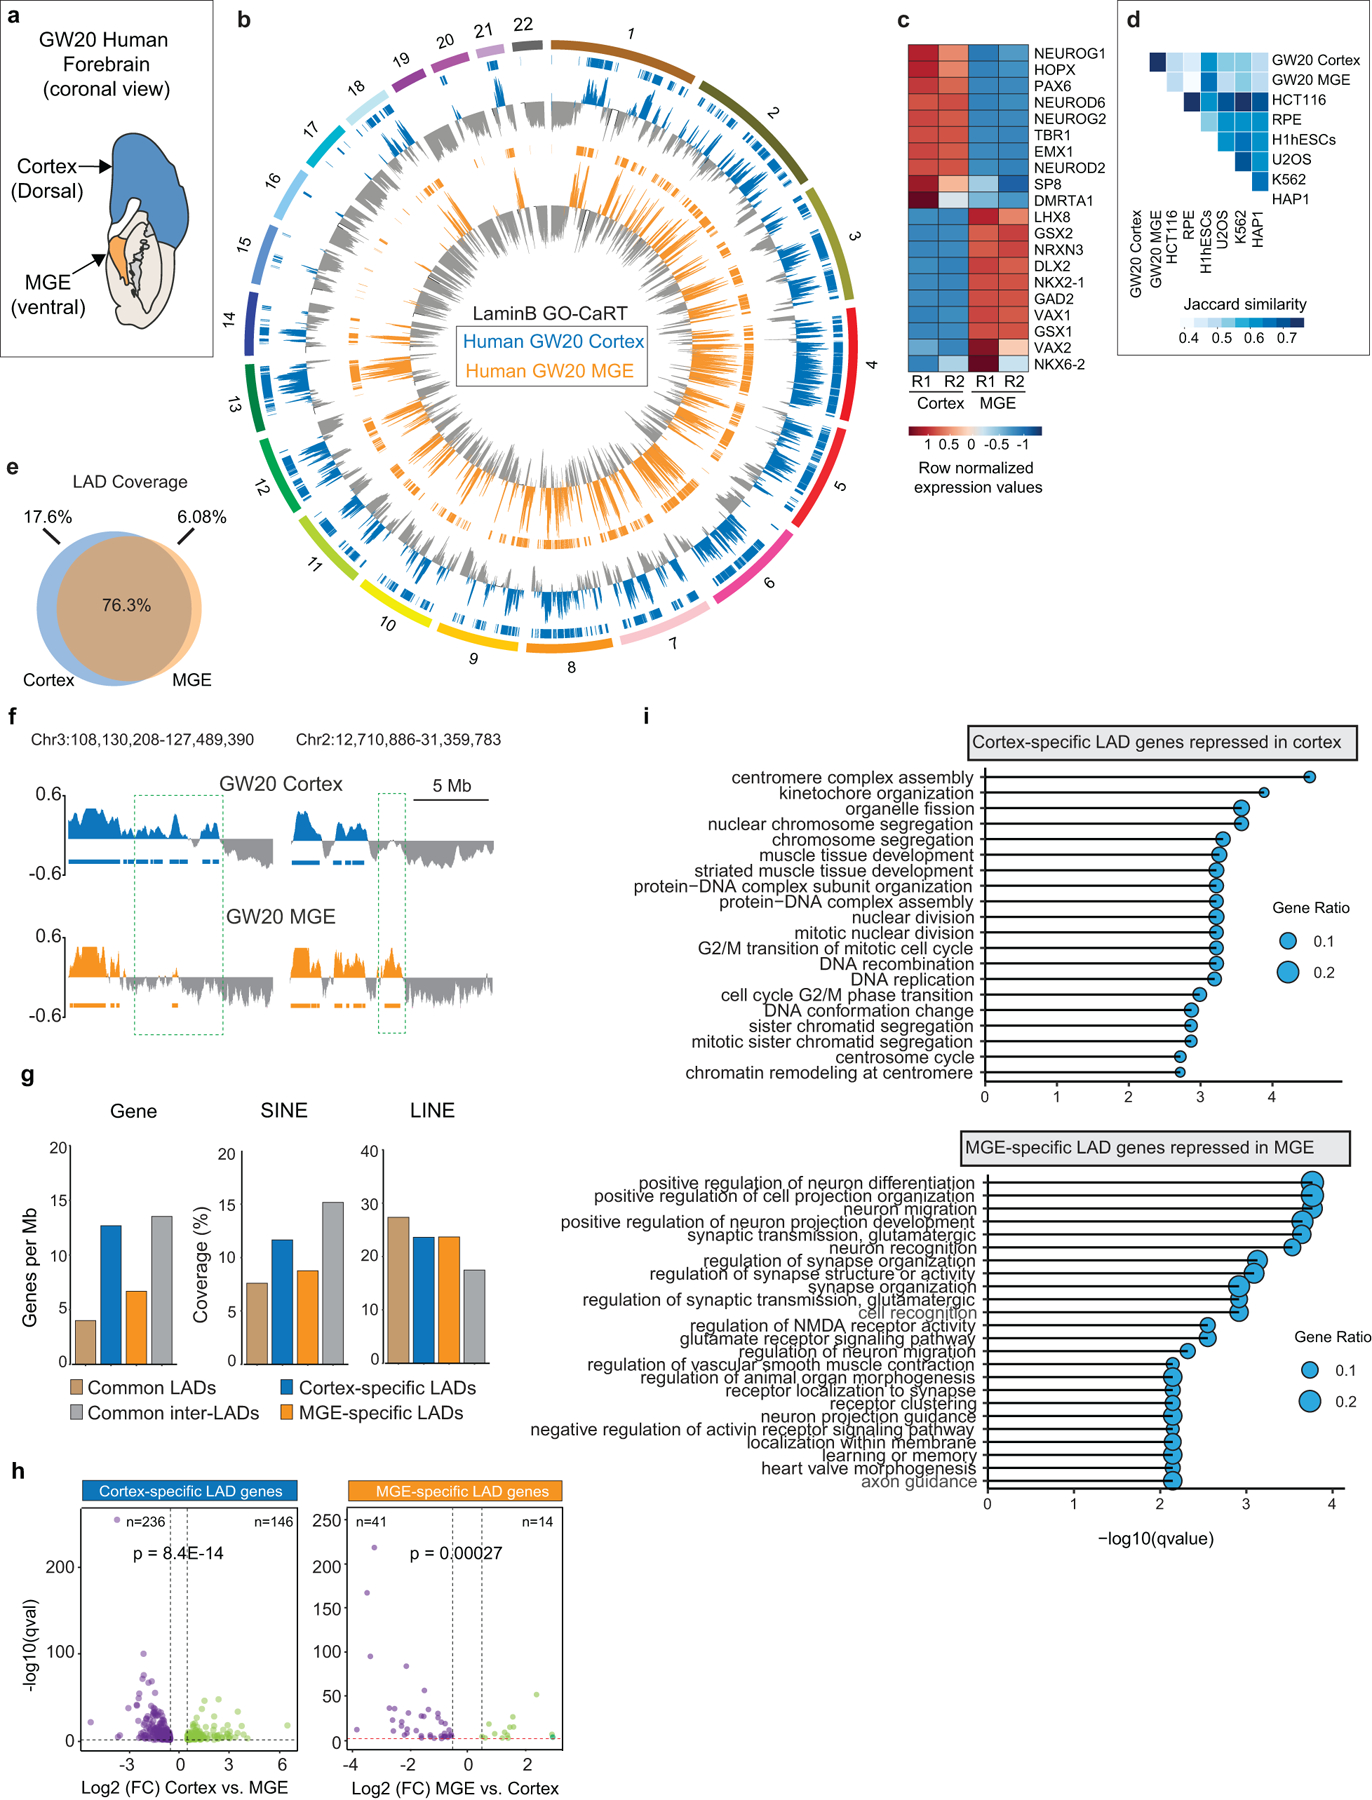
a, Schematic of a GW20 human brain (coronal view) showing regions sampled for GO-CaRT and RNA-seq. b, Circos plot showing LaminB enrichment and LADs (horizontal bars) across the human chromosomes (1–22) in GW20 cortex and MGE. c, Heatmap showing gene expression differences (row normalized) of marker genes in GW20 cortex and MGE. R1 and R2 indicate two biological replicates. d, Jaccard similarity matrix of GO-CaRT LADs identified in human cortex and MGE and DamID LADs in indicated cultured cell lines19. e, Venn diagram showing percent overlap of LAD coverage between GW20 cortex and MGE. f, Representative LaminB GO-CaRT profiles of GW20 cortex and MGE. Dashed boxes show brain region-specific LADs. g, Genomic features of human brain region-specific LADs, common LADs and inter-LADs. h, Volcano plot showing differentially expressed genes in GW20 cortex- and MGE- specific LADs. Each dot represents a single gene with its differential gene expression level plotted on the x-axis and statistical significance (q-value<0.5) on y-axis. p= Chi-square goodness of fit test. i, Top enriched GO-terms (biological process) of differentially expressed genes in cortex- and MGE- specific LADs. GO terms were sorted based on their significance, -log10(qvalue), the size of the bubble represents the gene ratio for each term.