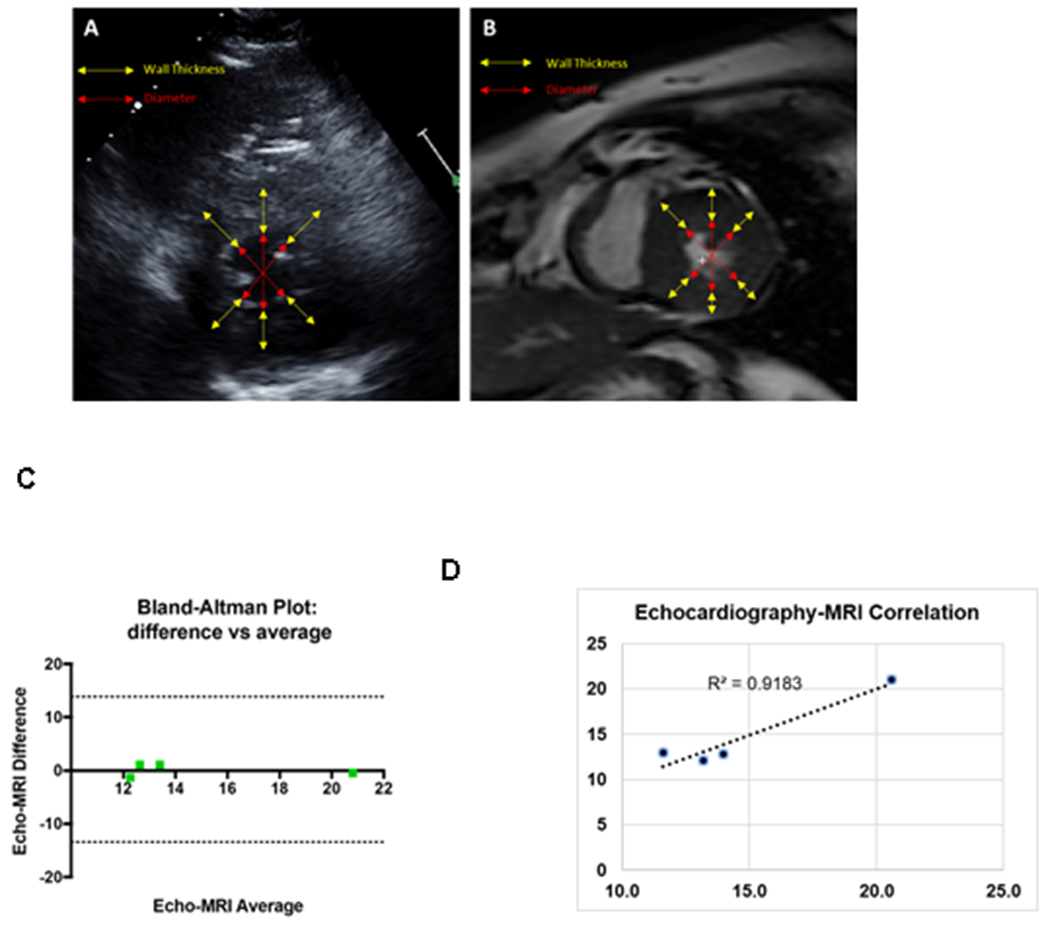
Figure 1: Analytical approaches for the comparison of end-systolic wall stress calculated by echocardiogram vs. cardiac MRI.

A. Representative echocardiography picture of a patient. B. Representative cardiac MRI picture of the same patient. MRI and echocardiographic acquisitions were obtained within the same day (3-hour apart). C. Dot plots showing the correlation between the ESWS calculated by echocardiography vs. cardiac MRI. D. Bland-Altman plot comparing the differences between the echocardiography vs. cardiac MRI-derived ESWS plotted against the averages of the two techniques.
