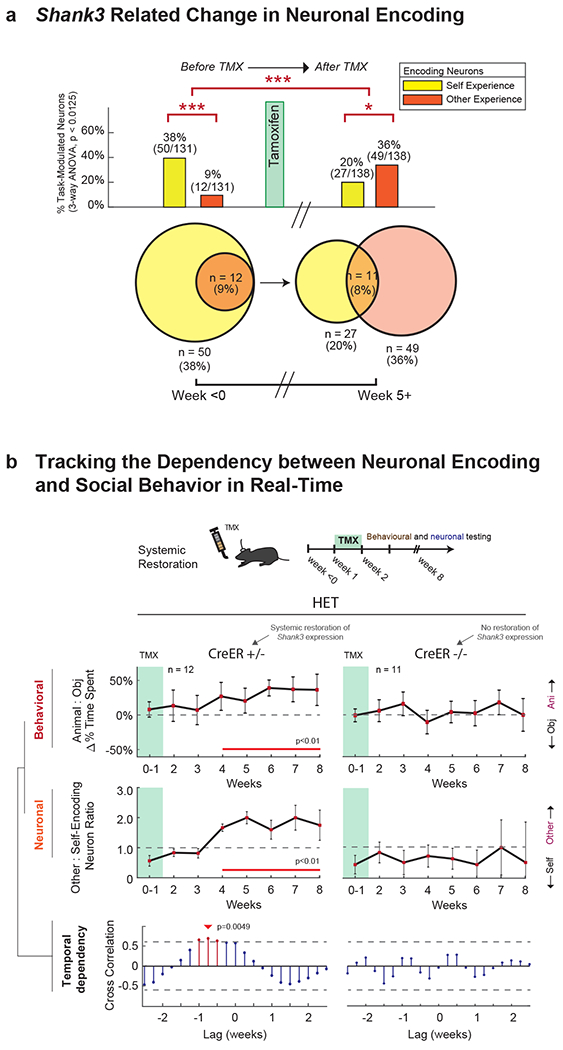
Fig. 5. Restoration of social behavior is dependent on the neuronal encoding of self-and-other.

a. Proportion of task-modulated neurons that encoded for variations in self- and other-experience, before (≤ 0 weeks) and after (≥ 5 weeks) TMX administration. n = 131 and n = 138 task-modulated neurons recorded from n = 12 HET and n = 12 HET + TMX mice, respectively. The Venn diagram below shows the overlap between other- and self-encoding neurons. Significances are displayed by Chi-square test analysis (*** χ2(1) = 30.51, p = 3.32x10⁻⁸). To the right, restoration of Shank3 expression is largely associated with a normalization of neuronal encoding responses (i.e., compared to Fig. 2a; *** χ2(1) = 28.18, p = 1.1x10⁻⁷, * χ2(1) = 8.79, p = .003). For additional analyses, see Supplementary Fig. 5. b. Behavioral and neuronal recordings were obtained from these n=12 animals over the course of 8 weeks after TMX administration, and compared with data from n=11 Shank3fx/+:CreER−/− mice that lacked the CreER recombinase gene and therefore displayed no increase in Shank3 expression. In the top panel, the curves represent the relative preference of the mice for another animal compared to an object (± S.E.M.) at weekly intervals. The horizontal line represents no preference. Whereas the Cre+/− mice displayed a significant increase in sociability over time compared to baseline (weeks 0-1), the Cre−/− mice did not. Time points in which there was a significant difference are underlined in red (one-sample t-tests, p < 0.01). In the middle panel, the curves represent the proportion of other-encoding compared to self-encoding neurons in the mPFC ± S.E.M. at weekly intervals. The horizontal line represents an equal proportion of neurons. Here, the Cre+/− mice displayed a significant increase in other-encoding neurons over time compared to baseline (weeks 0-1), whereas the Cre−/− mice demonstrated no change. Time points in which there was a significant difference are underlined in red (p < 0.01). The raw proportions of neurons and behavioral metrics are further provided in Extended Data Fig. 8a–b. Changes in the physical interaction times between the mice are shown in Extended Data Fig. 8e. In the bottom panel, the lines represent the degree of cross-correlation between changes in social behavior and change neuronal encoding (i.e., their statistical dependency). Red lines indicate time lags that were significant with the arrow indicating the optimal time lag at which change in social behavior proceeded change in neuronal encoding in the mPFC (0.75 weeks for the Shank3fx/+:CreER+/− mice).
