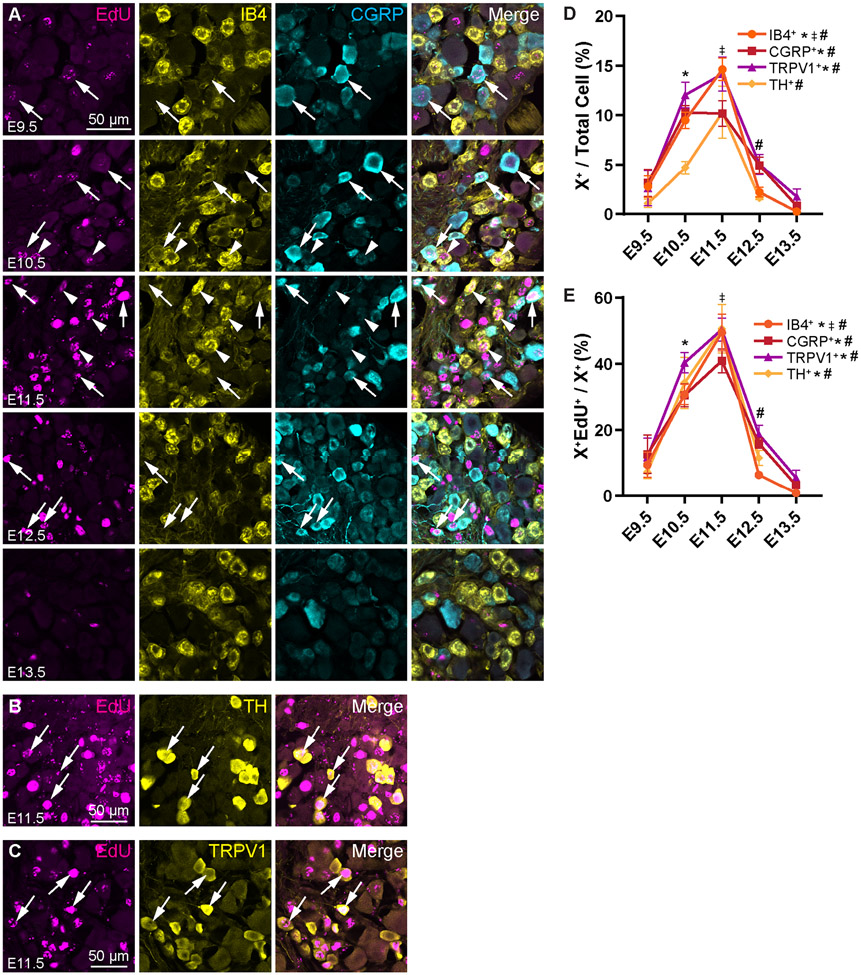
Figure 3. Non-peptidergic C-fibers and C-LTMRs are born mostly at E11.5, but significant portions of the populations are also born at E10.5 .
(A) Representative images showing EdU, IB4, and CGRP immunohistochemistry at P28 following injection of EdU at the indicated timepoints from E9.5 – E13.5. Arrows show EdU+ CGRP+ peptidergic nociceptors, arrowheads show EdU+ IB4+ non-peptidergic nociceptors. (B, C) Representative images of EdU+ TH+ (B) and EdU+ TRPV1+ (C) cells labeled at E11.5. (D, E) Quantitation of nociceptor populations labeled by EdU at each time point as a percentage of all DRG neurons (D) or that specific nociceptor subtype (E). Peptidergic nociceptors appear to be born continuously across developmental time with a peak spanning E10.5 to E11.5, while non-peptidergic C-fibers and C-LTMRs have peak birth rates more specifically at 11.5. * indicates a significant increase in births from E9.5 to E10.5, ‡ indicates a significant increase in births from E10.5 to E11.5, # indicates a significant decrease in births from E11.5 to E12.5; see Supplemental Table 3 for all statistics.

