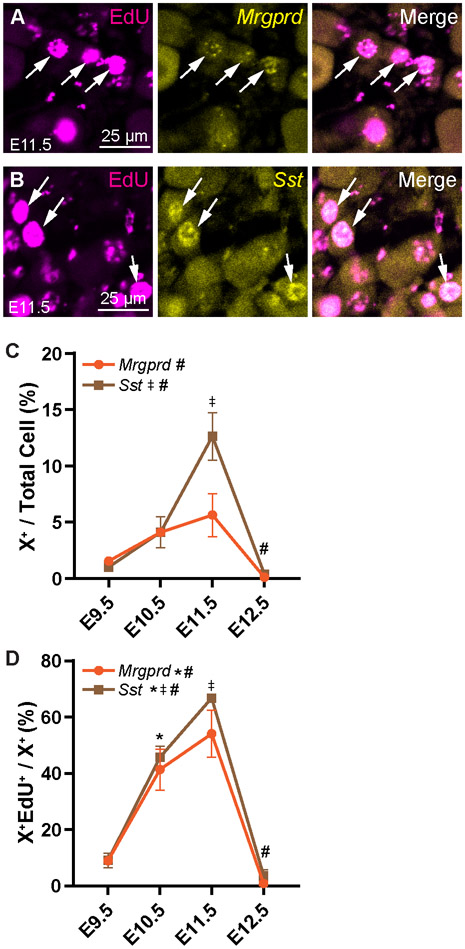
Figure 4. Birth rates in nociceptor populations identified by RNAscope are similar to those identified with antibody staining.
(A, B) Representative images of EdU labeling following RNAscope for Sst (A) and Mrgprd (B) after EdU injection at E11.5. (C, D) Quantitation of Sst+ and Mrgprd+ cells labeled by EdU at each time point as a percentage of all DRG neurons (C) or those expressing that marker (D). * indicates a significant increase in births from E9.5 to E10.5, ‡ indicates a significant increase in births from E10.5 to E11.5, # indicates a significant decrease in births from E11.5 to E12.5; See Supplemental Table 4 for all statistics.

