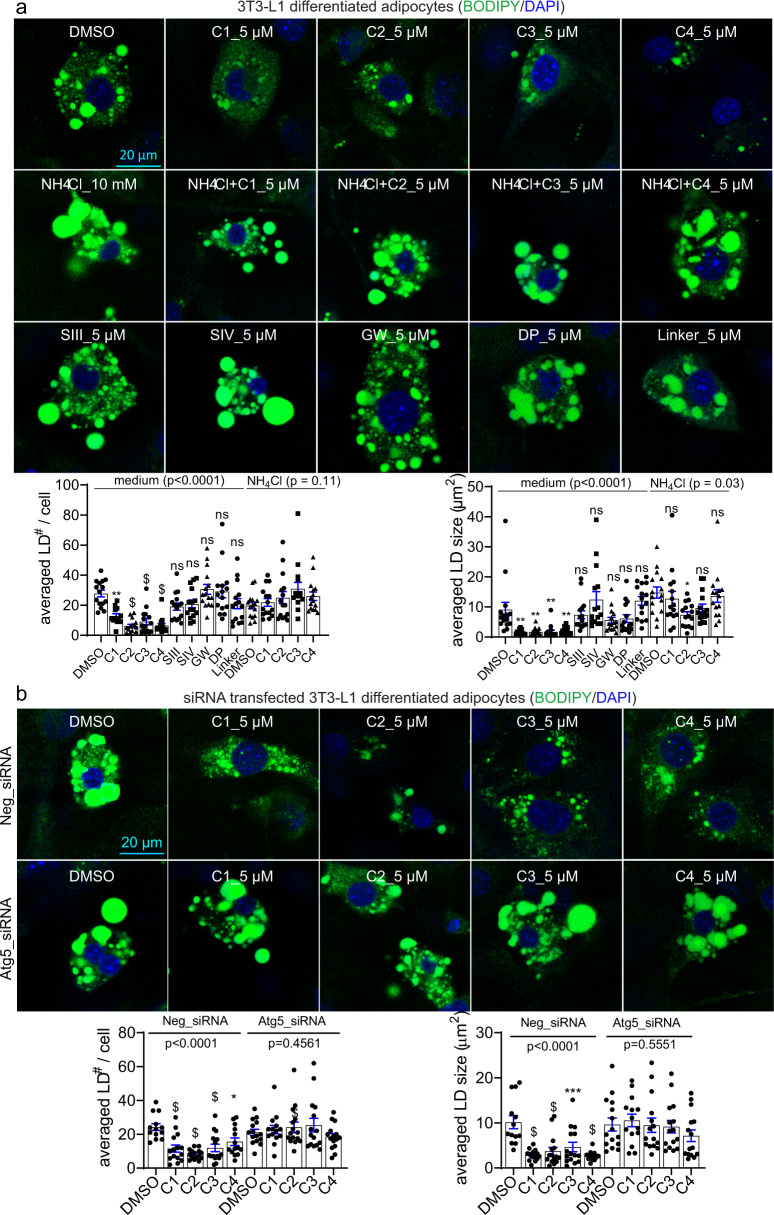
Fig. 3. LD·ATTECs significantly reduced endogenous LDs in 3T3-L1 differentiated adipocytes.
a Representative images and quantifications of the BODIPY493/503 staining of the endogenous LDs in the 3T3-L1 differentiated adipocytes treated with the indicated compounds (LD·ATTECs: C1, C2, C3 and C4). Bars indicate means ± SEM. The LD number per cell and averaged LD size in each field were quantified by ImageJ (particle analysis) in a blinded manner. ns, P > 0.05; *P < 0.05; **P < 0.01; ***P < 0.001; $P < 0.0001 by one-way ANOVA (P values have been indicated) and Dunnett’s post hoc tests (compared to the DMSO group, if the ANOVA test showed significance). b Similar to a, but in cells transfected with the indicated siRNAs 48 h before treatment with compounds.

