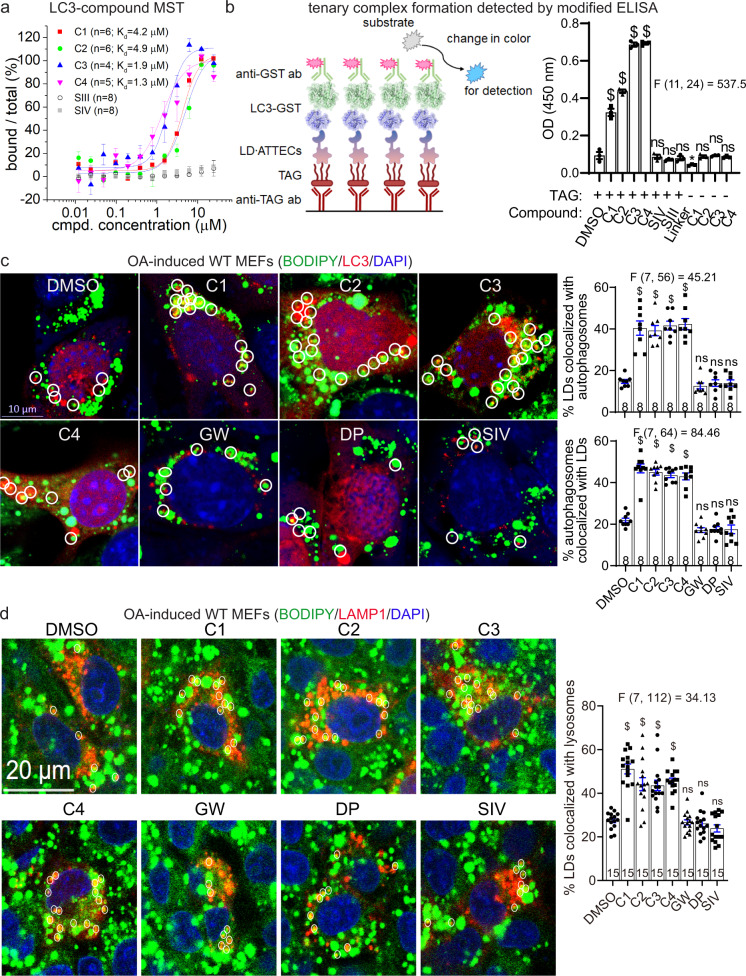
Fig. 4. Formation of the LC3B–ATTEC–LD ternary complex and colocalization between LC3B and LD.
a Measurements of the C1–LC3B, C2–LC3B, C3–LC3B, C4–LC3B, SIII–LC3B and SIV–LC3B binding affinity by MST. Submicromolar to micromolar Kd values were observed for the interaction between LC3B and LD·ATTECs (C1–C4), but not LD probes (SIII and SIV). b Left: schematic illustration of the measurements of the ternary complex formation using modified ELISA assays; Right: the blank-corrected ELISA signals of the indicated samples (n = 3, independent assay wells). All samples were added with recombinant purified LC3-GST for the final detection with the GST antibody, and the wells containing recombinant purified GST alone were used as the blank control. c Representative images and quantifications of mCherry-LC3B-transfected MEFs showing LDs (stained with BODIPY 493/503, green), autophagosomes (LC3B puncta, red) and nuclei (DAPI, blue). LD·ATTECs (C1–C4) but not the control compounds (all at 5 μM) induced significant partial colocalizations of LD and autophagosomes. The percentage of LDs that are partially colocalized with autophagosomes in each sample was analyzed by visual counting in a blinded manner. The replicate number indicates the number of fields from 2 independent batches of transfections. d Similar to c, but in LAMP1-mCherry-transfected MEFs showing colocalization between LDs and lysosomes (LAMP1). Bars indicate means ± SEM. ns, P > 0.05; $P < 0.0001 by one-way ANOVA (the F and degree of freedom values have been indicated for each plot) and Dunnett’s post hoc tests (compared to the DMSO group).

