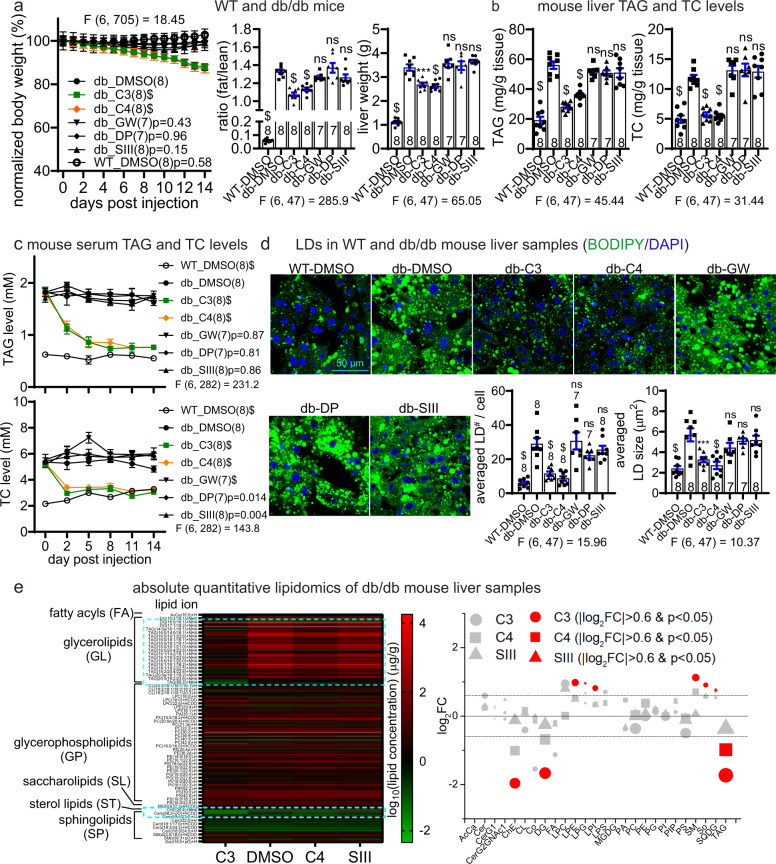
Fig. 6. LD·ATTECs lowered body fat, neutral lipids and LDs in vivo in db/db mice.
The db/db mice (db) were injected with the indicated compounds at one dosage per day for the indicated days. The WT mice fed on chow diet (WT) were used as the baseline control. a Measurements of body weight (measured each day and normalized to the averaged weight of day 0, left panel), fat/lean ratio (after injection for 12 days, middle panel) and liver weight (endpoint measurement after injection for 14 days, right panel) in the indicated mice injected with the indicated compounds. b The endpoint measurements (after injection for 14 days) of the TAG and TC levels of liver samples in the indicated mice injected with the indicated compounds. c Measurements of the serum TAG and TC levels in db/db mice injected with the indicated compounds. Serum was collected at several different time points after injection as indicated. d Representative images and quantifications of the BODIPY493/503 staining of the endogenous LDs in the liver slice samples from the mice injected with the indicated compounds for 14 days. For quantifications, images of each mouse (from at least 3 slices) were averaged. e Absolute quantitative lipidomics of liver in db/db mice (4 per group). Left: the averaged log10 expression of the lipids in the samples. The expression rather than the fold change was plotted to avoid over-representation of low-expression lipids, which typically give high fold changes. Darker red or brighter green indicates lower concentrations. The major different regions were highlighted by the dashed cyan box. The DMSO was placed in the middle for easier comparison. Right: log2FC compared to the DMSO group are plotted for each lipid class (X axis). A few lipid classes with extremely low abundance (total concentration < 1 μg/g) were neglected. The area of each symbol represents the abundance of the lipid class in the DMSO group. The red color indicates significant changes (|log2FC| > 0.6 and P value < 0.05 by the two-tail unpaired t-test). See Supplementary information, Data S3 for the detailed list of detected lipids and the table of abbreviations of lipid categories and classes. For all plots, data were plotted as means ± SEM. The replicate number indicates the number of mice. ns, P > 0.05; $P < 0.0001; exact P values are shown if space allows. For measurements at multiple time points, two-way ANOVA (the F and degree of freedom values for the treatment factor have been indicated) and Dunnett’s post hoc tests (compared to the DMSO-treated db/db group) were performed. For endpoint measurements for multiple groups, one-way ANOVA (the F and degree of freedom values have been indicated) and Dunnett’s post hoc tests (compared to the DMSO-treated db/db group) were performed.

