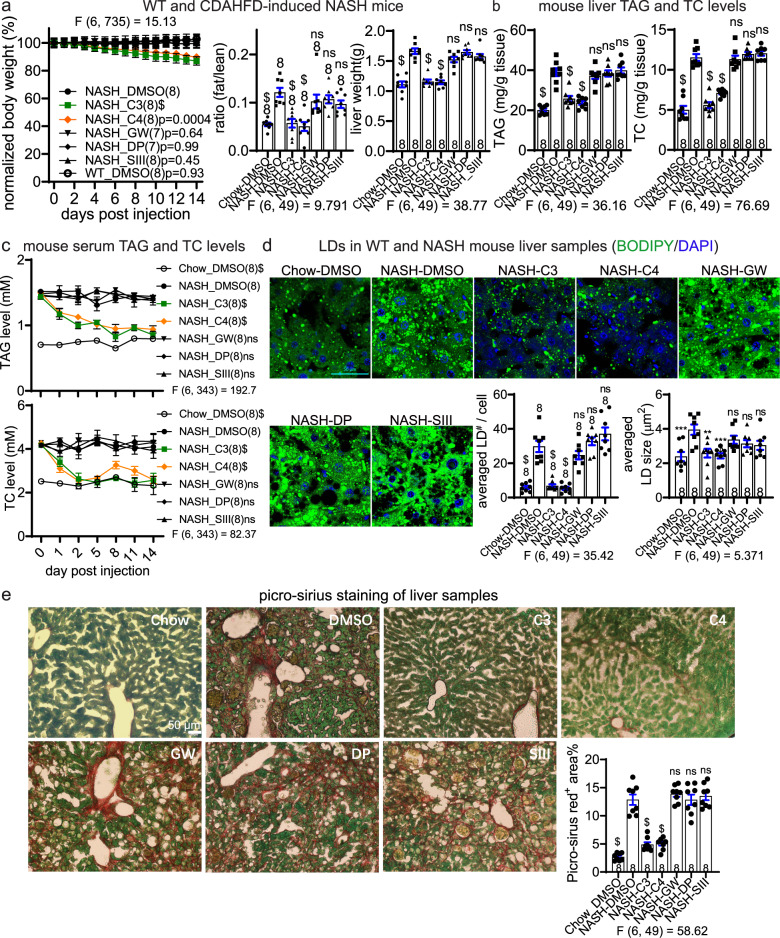
Fig. 7. LD·ATTECs were effective in vivo in CDAHFD-induced NASH mice.
Similar to Fig. 6, but using the CDAHFD-induced NASH mice. Note that the same group of WT mice fed on chow diet (WT) were used as the baseline control. a Measurements of body weight (measured each day and normalized to the averaged weight of day 0, left panel), the fat/lean ratio (after injection for 12 days, middle panel), and liver weight (endpoint measurement after injection for 14 days, right panel) in the indicated mice injected with the indicated compounds. b The endpoint measurements (after injection for 14 days) of the TAG and TC levels of liver samples in the indicated mice injected with the indicated compounds. c Measurements of the serum TAG and TC levels in NASH mice injected with the indicated compounds. Serum was collected at several different time points after injection as indicated. d Representative images and quantifications of the BODIPY493/503 staining of the endogenous LDs in the liver slice samples from the mice injected with the indicated compounds for 14 days. Scale bar, 50 μm. e Representative images and quantifications of picro-sirius staining to evaluate the interstitial fibrosis in the liver samples from the mice injected with the indicated compounds for 14 days. The red+ area normalized to green+ area was quantified to evaluate the degree of liver fibrosis. For all plots, data were plotted as means ± SEM. The replicate number indicates the number of mice. For measurements at multiple time points, two-way ANOVA and Dunnett’s post hoc tests (compared to the DMSO-treated NASH group) were performed. For endpoint measurements for multiple groups, one-way ANOVA and Dunnett’s post hoc tests (compared to the DMSO-treated NASH group) were performed. F and degree of freedom values have been indicated, and exact P values are shown if space allows.

