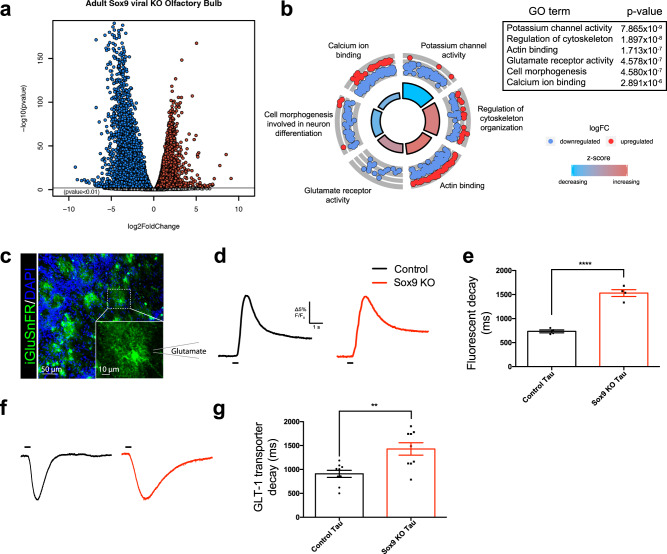
Fig. 5. RNAseq revealed a significant change in transcription profile of adult, Sox9-deleted astrocytes.
a Volcano plot of genes significantly upregulated (red dots) and downregulated (blue dots) in Sox9-deleted astrocytes compared to controls. b Downregulated genes from Sox9 deletion revealed GO terms associated with neurotransmitter receptor and ion channel activity, as well as cellular morphology. c Representative high resolution image of iGluSnFR expressed in astrocytes in the OB. N = 4 mice. Inset: high magnification of a single astrocyte with schematic of glutamate puffer nearby astrocyte. d Example trace of iGluSnFR signal from control and Sox9 KO astrocytes after puffing glutamate [534 mM]. Black line indicates duration of glutamate puff. e Quantification of (d). Sox9 KO astrocytes had a significantly increased decay after puffing glutamate. n = 37 cells (control) and n = 35 cells (Sox9 KO) from N = 4 mice, respectively. ****p < 0.0001. Two-tailed Student’s t-test. Data are presented as mean values ± SEM. f Example peak normalized traces from whole cell electrophysiological recordings of glutamate transporter currents in astrocytes. Black line indicates duration of glutamate puff. g Quantification of (f). Sox9 KO astrocytes had a significantly increased decay after puffing glutamate. n = 9 cells (control) and n = 9 cells (Sox9 KO) cells from N = 4 and 3 mice, respectively. **p = 0.0032. Two-tailed Student’s t-test. Controls in A-B and F-G are C57BL/6 J injected with AAV-GFAP-iCre-P2a-TurboRFP; controls in C-E are C57BL/6 J injected with AAV-GFAP-iGluSnFR. Data are presented as mean values ± SEM.

