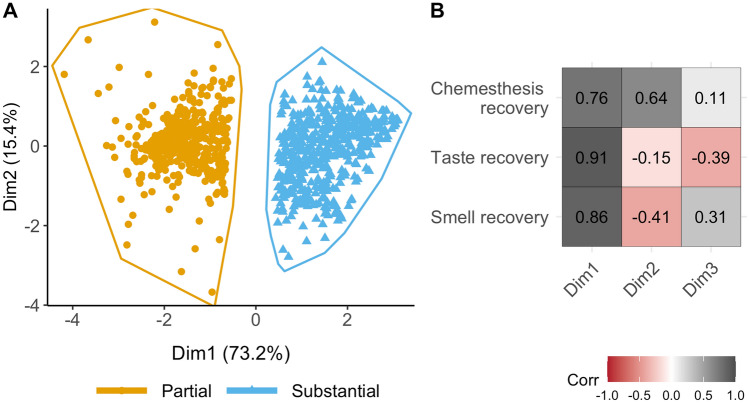
Figure 2.
(A) Clusters of participants on chemosensory recovery identified by k-means clustering. The scatterplot shows each participant's loading on Dimension 1 (Dim1) and Dimension 2 (Dim2) of the Principal Component Analysis. Partial = smell, taste, and chemesthesis partial recovery; Substantial = smell, taste, and chemesthesis substantial recovery. (B) Correlations between the three principal components with respect to recovery in smell, taste, and chemesthesis. Gray color indicates a positive correlation, whereas shades of red indicate negative correlations. Darker shades indicate stronger correlations.

