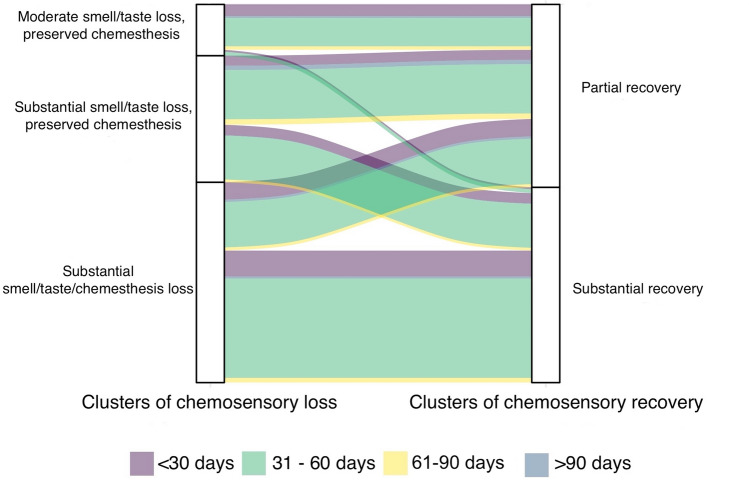
Figure 3.
Alluvial plot showing the pattern of chemosensory loss and recovery clusters in relation to days between the date of onset and completion of the questionnaire. On the left 3 clusters of chemosensory loss while on the right 2 clusters of chemosensory recovery. The flows between the blocks depict the path from loss to recovery. The different colors of flows represent the different time intervals (in days) between the date of onset and completion of the questionnaire. The width of the flow represents the fraction of participants experiencing the recovery either partial or substantial.

