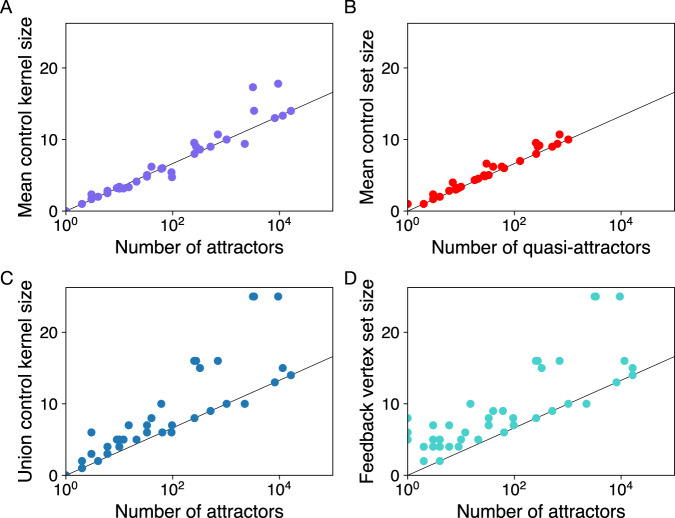
Fig. 2. Comparing our control kernel results with those obtained using two alternative methods for computing controlling nodes.
A For comparison, we replot mean control kernel size versus number of attractors, as in Fig. 1A. B Mean control set sizes computed for 36 networks using the stable motif algorithm, which groups some cyclic attractors into quasi-attractors. Logarithmic scaling of the control set sizes with respect to the number of quasi-attractors is clearly visible. C For comparison to the feedback vertex set, which places an upper bound on the minimal control set required to reach all attractors, we compute the size of the union of control kernel nodes of each network across all its attractors. D The size of feedback vertex sets is comparable to union control kernel sizes in C.

