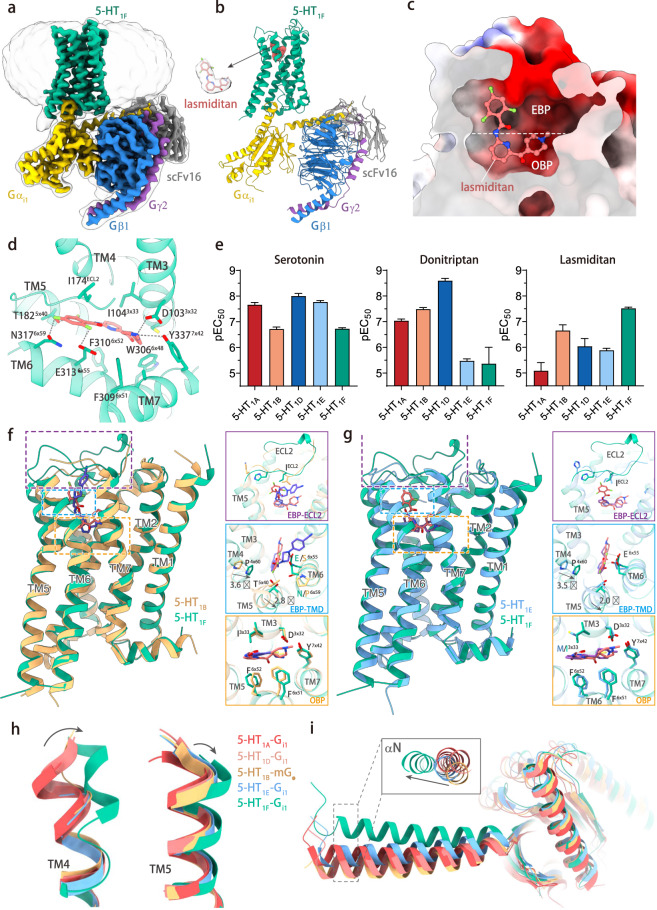
Fig. 1. Structure of lasmiditan–5-HT1F–Gi1 complex.
a Cryo-EM map of the 5-HT1F–Gi complex. b Structural model of the 5-HT1F–Gi complex. The ligand model is shown on left side of the complex with surrounding density map. c Electrostatic surface representation of lasmiditan-binding pocket of 5-HT1F. d The binding mode of lasmiditan in the ligand-binding pocket of 5-HT1F. e Gi recruitment assay using NanoBiT for wild-type 5-HT1A, 5-HT1B, 5-HT1D, 5-HT1E, and 5-HT1F induced by serotonin, donitriptan and lasmiditan. f Structural comparison of lasmiditan-bound 5-HT1F and donitriptan-bound 5-HT1B (PDB code: 6G79). g Structural comparison of lasmiditan-bound 5-HT1F and BRL54443-bound 5-HT1E (PDB code: 7E33). h Structure comparison focuses on extracellular ends of TM4 (left) and TM5 (right) among 5-HT1A (red, PDB code: 7E2Y), 5-HT1B (tan, PDB code: 6G79), 5-HT1D (yellow, PDB code: 7E32), 5-HT1E (blue, PDB code: 7E33) and 5-HT1F (green). i Comparison of the Gα conformation among the structures of Gi/o-coupled 5-HT1A (red, PDB code: 7E2Y), 5-HT1B (tan, PDB code: 6G79), 5-HT1D (yellow, PDB code: 7E32), 5-HT1E (blue, PDB code: 7E33) and 5-HT1F (green).

